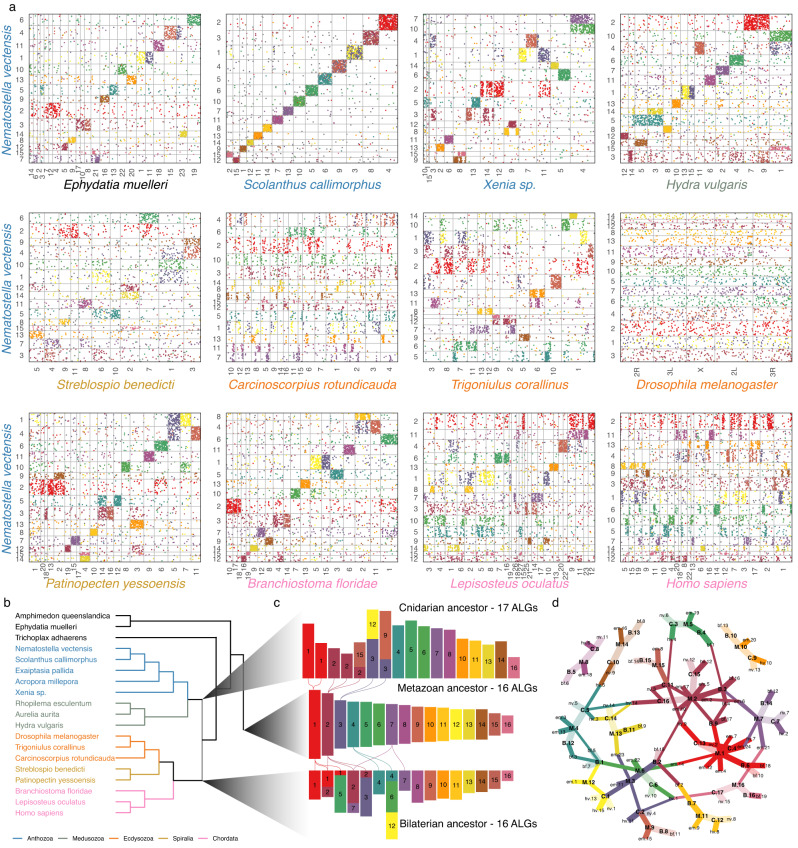
Fig. 2. Macrosynteny conservation of edwardsiid genomes and reconstruction of ancestral linkage groups.
a Oxford plots of the macrosyntenic relationships of Nematostella vectensis (y-axis) to genomes of various metazoans (x-axis). Pairwise orthologous are ordered by their position on the chromosome labeled on the axis. Dots (genes) are colored according to their membership to the metazoan ancestral linkage groups (ALGs) shown in (c). Species names are colored according to clade shown in (b). b Genomes represented in this figure and Supplementary Figs. 5–7. c Relationships between the ALGs colored according to the metazoan ALG. Lines are drawn between ALGs to represent fissions. d Graph representing the relationships of metazoan (M), bilaterian (B), and cnidarian (C) ALGs to each other and extant genomes of Ephydatia (em), Nematostella (nv), Rhopilema (re) and Branchiostoma (bf). Edges are colored by the metazoan ALG in (b) from which its path has a source. Line width represents the fraction of the extant genome or derived ALG (bilaterian or cnidarian) content of the ancestral genome. Faded edges represent near one-to-one relationships (>0.8).

