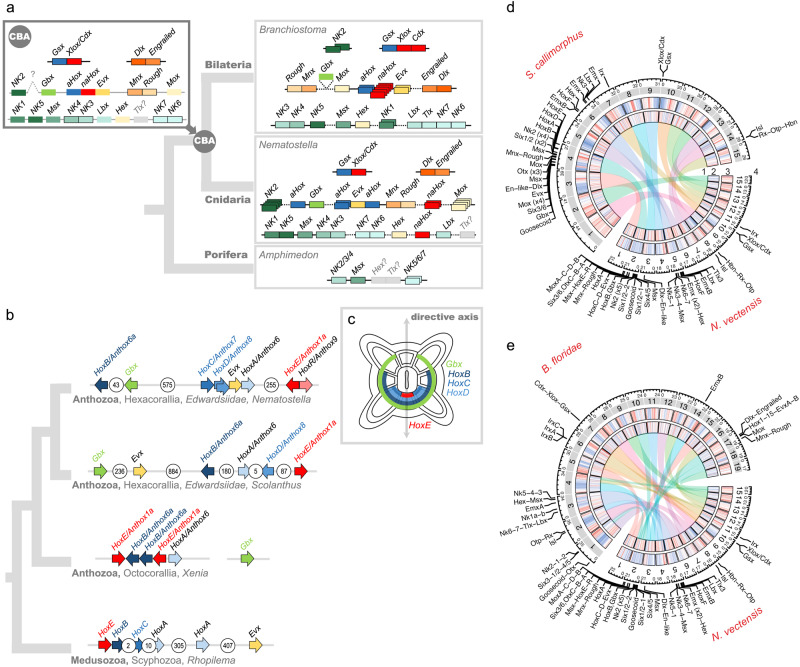
Fig. 3. Evolution of a selection of Antennapedia class homeobox gene clusters.
a Composition of the extended Hox, ParaHox, and NK clusters in the sponge Amphimedon, the sea anemone Nematostella, in a chordate Branchiostoma, and the deduced cluster composition of the cnidarian-bilaterian ancestor (CBA). Grayed-out genes with question marks have uncertain orthology. Genes shown as borderless boxes have an uncertain position relative to neighboring cluster members. Stacked boxes represent clusters of paralogs of the indicated ancestral gene. Genes in immediate proximity are indicated by abutting boxes. Linked genes of the same class separated by 1 to 50 intervening genes are connected with solid lines, over 50, with dashed lines. Gray intergenic connectors in the CBA indicate that the distances and the number of the intervening genes between the cluster members cannot be estimated. NK2 of the CBA may be linked to the extended Hox cluster. Since Branchiostoma Gbx remained unplaced in the chromosome-level assembly, its position was taken from the scaffold-level assembly of Branchiostoma lanceolatum159. A two-gene ParaHox CBA scenario is shown although a three-gene ParaHox CBA scenario is possible based on evidence from Scyphozoa21. b Organization of the Nematostella Hox cluster in comparison to the Hox clusters of Scolanthus, the octocoral Xenia and a scyphozoan jellyfish Rhopilema indicates loss of microsynteny. c Staggered expression of Gbx and Hox genes along the directive axis of Nematostella (oral view) partially reflects the position of the genes on the chromosome. Arrows show the direction of transcription for each of the genes. The number of intervening genes is indicated in white circles. d, e Chromosomal relationships, genomic content and locations of NK and extended Hox cluster and other landmark homeobox genes of (d) Nematostella and Scolanthus and (e) Nematostella and Branchiostoma. 1) Chord diagram of macrosyntenic relationships of chromosomes based on the inferred ancestral linkage groups. 2) Scaled and centered gene density relative to the respective genome (red=high, blue=low). 3) Scaled and centered density of interspersed repeat elements relative to the respective genome (red=high, blue=low). 4) Locations of the landmark homeobox genes.

