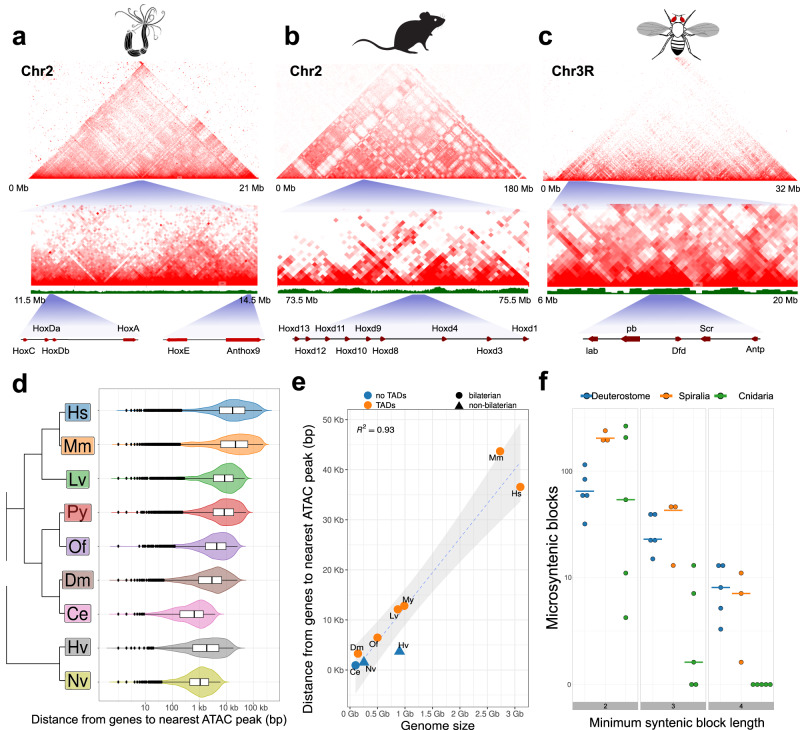
Fig. 4. Hi-C contact maps.
Contact maps (a) Nematostella Hox clusters, (b) Mouse HoxD cluster and (c) Fly Hox cluster show striking differences in the patterns of intrachromosomal interactions; d distribution of the distance from ATAC-seq peaks to their closest peak for human (Hs; n = 2069; SEM = 708.23), mouse (Mm; n = 73,834; SEM = 192.78), Sea urchin (Lytechinus variegatus, Lv; n = 6441; SEM = 139.49), mussel (Patinopecten yessoensis, Py; n = 8831; SEM = 132.51), polychete (Owenia fisuformis, Of; n = 3245; SEM = 107.08), fly (Dm; n = 2811; SEM = 77.38), Caenorhabditis (Ce; n = 4043; SEM = 14.55), Hydra vulgaris (Hv; n = 2069; SEM = 94.12) and Nematostella vectensis (Nv; n = 1611; SEM = 35.3) Vertical bars represent the median, boxes represent the interquartile range and whiskers represent 1.5× the interquartile range. Outliers are represented by dots; e correlation of mean gene-ATAC-seq peak distance and genome size for the same species (regression confidence interval 95%).; f Number of microsyntenic blocks of 2, 3, and 4 genes in cnidarians, deuterostomes and spiralians. The number of syntenic blocks falls rapidly in cnidarians compared to deuterostomes and spiralians as the synteny length increases. Horizontal bars represent the distribution median of within-clade comparisons. Mouse silhouette is from PhyloPic (https://www.phylopic.org/; Daniel Jaron, 2018).

