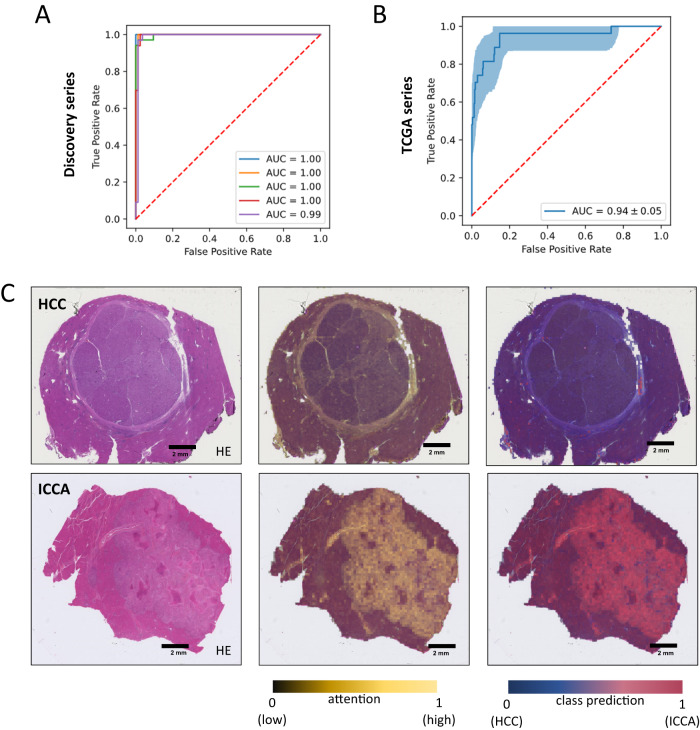
Fig. 2. Development of a deep-learning model for HCC/ICCA classification.
A Receiver operator curve (ROC) for the internal validation of binary classification of HCC and iCCA cases. B ROC curve for the external validation of binary classification (HCC vs. ICCA) task on TCGA dataset. The error band shows the 1000 fold bootstrapped 95% confidence interval. C H&E slide of two randomly selected cases for HCC and ICCA. Attention map of the model and the class prediction scores are used as explainability methods to check the capability of the trained model in detecting the correct features within the WSI. The class prediction heatmap is weighted by the attention. Source data are provided as a Source Data file. This analysis was repeated independently with similar results five times.

