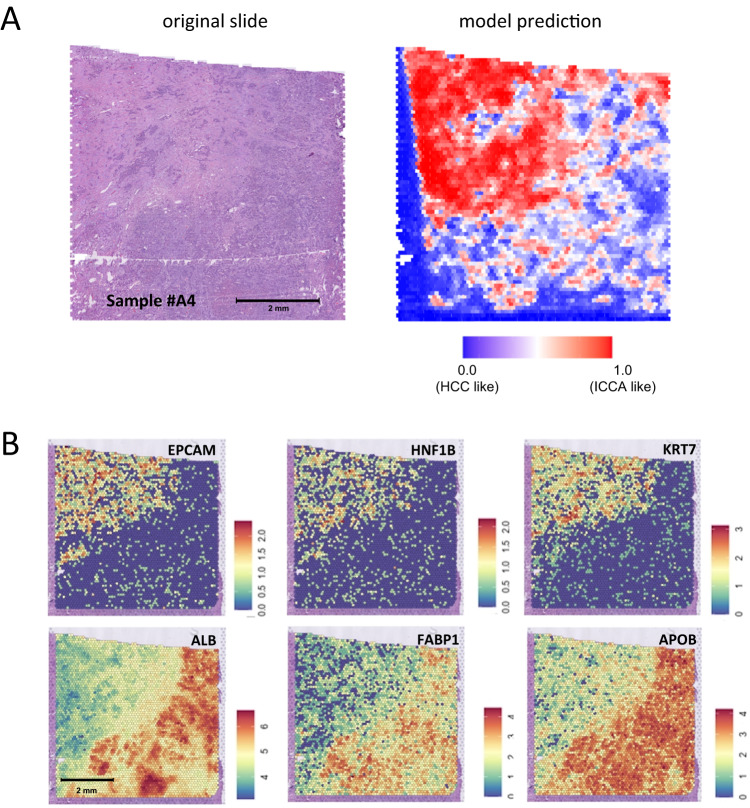
Fig. 4. Combination of deep-learning heatmaps with spatial transcriptomics unravels the gene expression profile of areas that markedly impact the predictions.
A Example of a case processed by spatial transcriptomics: the HE section and its corresponding prediction heat map are presented, with the upper left area being considered as ICCA-like. This analysis was repeated independently with similar results for two other cases, as mentioned in the section “Spatial Transcriptomics Analysis and AI Predictions”. B Predictions matches the in situ gene expression profile with the ICCA like area showing upregulation of biliary/cholangiocytic genes (EPCAM, HNF1B and KRT7) and downregulation of hepatocytic genes (ALB, FABP1 and APOB). Raw data are available online as described in the “Data Availability” Section.

