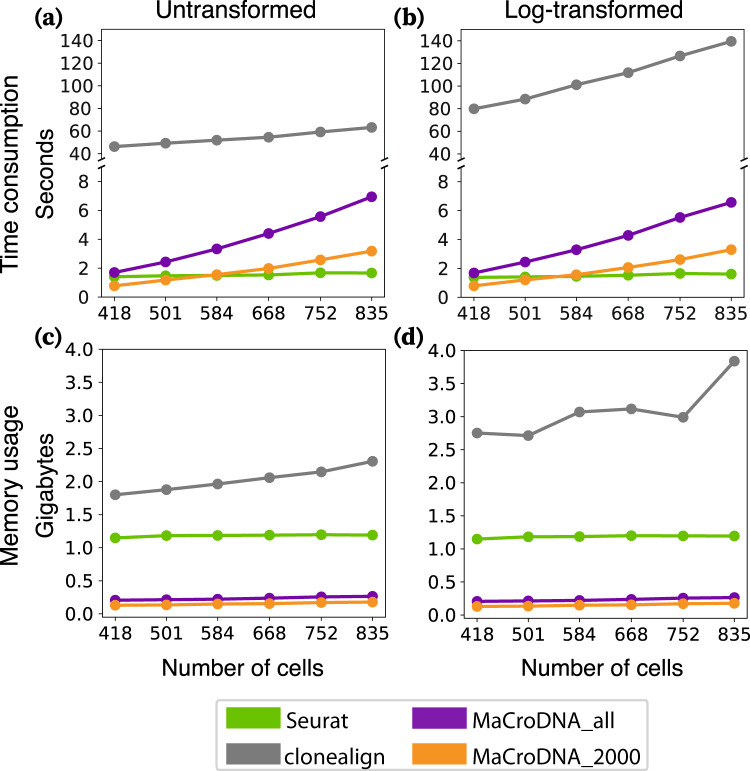
Fig. 5. Time consumption and memory usage of clonealign, Seurat, and MaCroDNA using different amounts of cells.
The data was sampled separately in each patient at the same sampling rate. For MaCroDNA, both 2000_genes_log and all_genes_log are used as the preprocessed data. a is the time consumption using the untransformed clones. b is the time consumption using the log-transformed clones. c is the peak memory usage using the untransformed clones. d is the peak memory usage using the log-transformed clones. The different colors distinguish the results of different methods: green for Seurat, gray for clonealign, orange for MaCroDNA with 2000_genes_log data, and purple for MaCroDNA with all_genes_log data. Source data are provided as a Source Data file.

