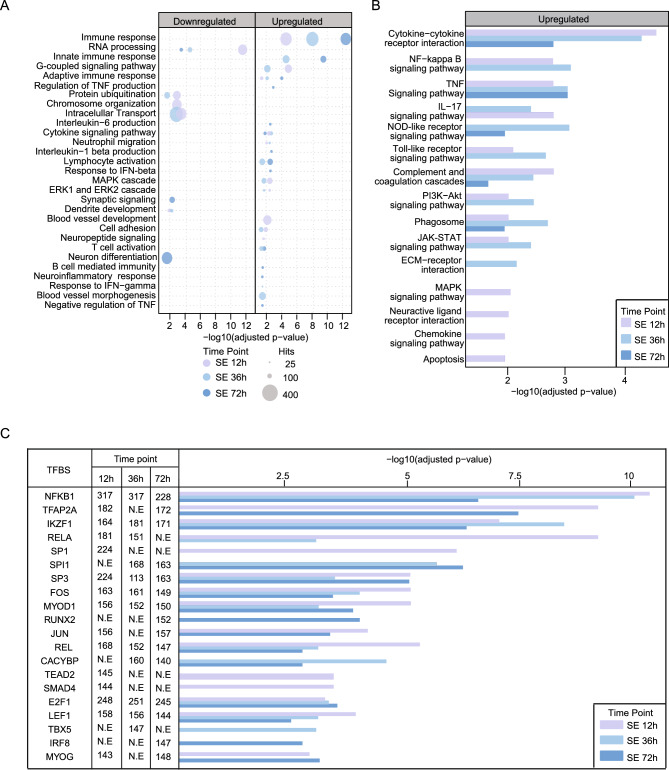
Figure 2.
Complex gene expression dynamics in the early phase of epileptogenesis. (A) GO analysis of differentially expressed genes (DEGs) (p ≤ 0.05; Log2FC ≥ |0.66|) at 12 h, 36 h and 72 h after pilocarpine-induced SE. (B) KEGG pathway analysis of DEGs (p ≤ 0.05; Log2FC ≥ |0.66|) at 12 h, 36 h and 72 h after pilocarpine-induced SE. (C) Transcription factor enrichment from JASPAR and TRANSFAC database (p < 0.05) of upregulated DEGs (p ≤ 0.05; Log2FC ≥ |0.66|) at 12 h, 36 h and 72 h after pilocarpine-induced SE.

