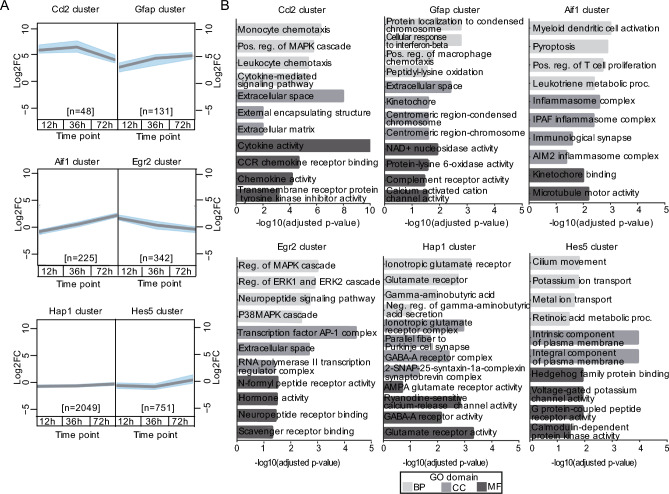
Figure 3.
Highly dynamic gene expression clusters associate with a time-dependent immune response. (A) Bayesian Hierarchical Clustering analysis of DEGs (p ≤ 0.05; Log2FC ≥|0.66|) identified distinctive time-dependent gene activation patterns. Clusters aligned to k-means clustering were selected for further analysis. Grey lines represent the median, and blue shading the upper and lower quantiles. (B) GO analysis (Biological Process, Cellular Components and Molecular Functions) for DEGs in each of the six clusters depicted in (A).

