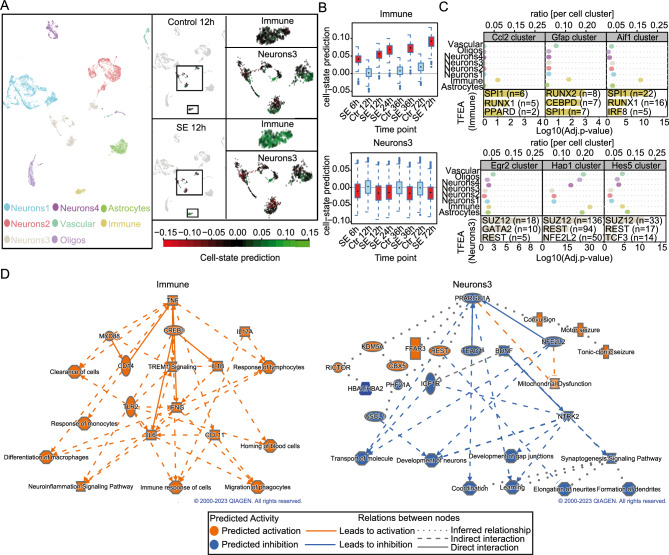
Figure 4.
Distinct cell populations are associated with upstream regulators triggering immune response and neuronal dysfunction. (A) Uniform manifold approximation and projection (UMAP) of single cell data from CA1 hippocampal cells with eight defined clusters (left panel). Representative UMAP example of SE 12 h reveals distinct cell states compared to control 12 h, mainly originating from the “immune” and “neurons3” clusters (right panels). (B) Cell-state prediction of the “immune” (upper panel) and “neurons3” (lower panel) clusters of control (12 h, 36 h and 72 h) and SE (6 h, 12 h, 24 h, 36 h and 72 h). (C) Proportion of individual cell clusters belonging to six selected BHC clusters. TFEA depicts predictive TFs regulators for each cluster for “Immune” population (upper panel) and “Neurons3” (lower panel). n-numbers indicate the numbers of genes associated with each TF. (D) Graphical summary of the IPA analysis of the “Immune” and Neurons3″ populations. The graphical summaries were generated using the QIAGEN IPA software v01-22-01 (QIAGEN Inc., https://digitalinsights.qiagen.com/IPA).

