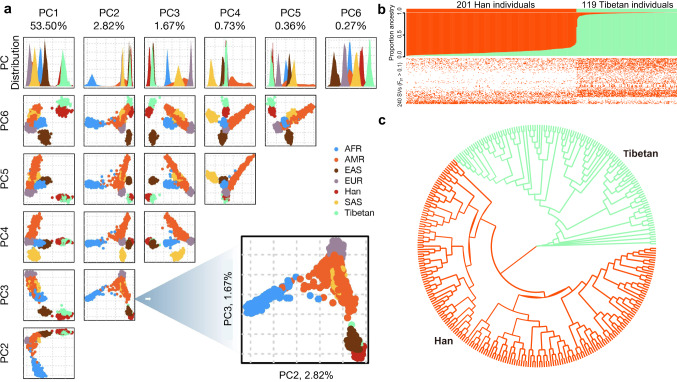
Fig. 3. Population genetics of Han & Tibetan populations.
a PCA of the SV call sets of the Han and Tibetan cohorts and African (AFR), American (AMR), East Asian (EAS), European (EUR) and South Asian (SAS) cohorts from the 1KGP. The Han (red) and Tibetan (green) populations are close to the EAS (brown) populations, as expected, and are be clearly separated according to PC2 and PC3. b Population structure of the Han and Tibetan populations. Admixture analysis (top panel), clustered SVs with an FST > 0.1 (bottom panel). The SVs can be used to distinguish two populations, although the number of SVs per individual in the two populations is similar. c A clear separation between Han and Tibetan populations is observed in the evolutionary tree analysis based on all the SVs of Han (red) and Tibetan (green) populations.

