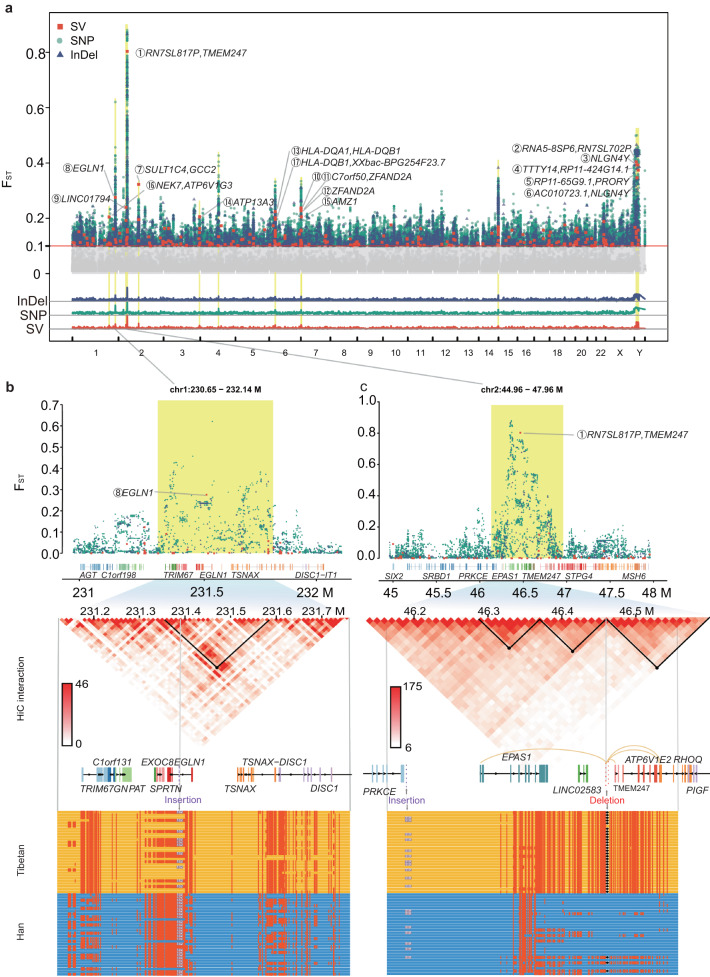
Fig. 4. Comparison of Han & Tibetan populations reveals the genetic landscape of evolutionary adaptation.
a Manhattan plot (top panel) based on the FST values of SVs (orange-red boxes), SNPs (blue-green dots) and InDels (dark blue triangles) between the Han and Tibetan cohorts. Overall, 17 SVs with an FST > 0.2 are highlighted (orange-red), and associated genes are labelled (black) with their ranks (circled number). The shadows in the Manhattan plot for SVs, SNPs and InDels (bottom panel) suggest the high consistency of evolutionary selection for SVs, SNPs and InDels. b Manhattan plot (top panel), TAD (middle panel) and haplotype (bottom panel) near EGLN1 on chromosome 1 based on the FST values of SNPs, InDels, and SVs between the Han and Tibetan cohorts. A 132 bp insertion (grey) in the intron of EGLN1 shows high LD r2 with SNPs (red dot) and is within a loop (black dot and inverted triangle). c Manhattan plot (top panel), TAD (middle panel) and haplotype (bottom panel) near EPAS1 and TMEM247 on chromosome 2 based on the FST values of SNPs, InDels, and SVs between the Han and Tibetan cohorts. The most Tibetan-specific deletion disrupts an enhancer (grey arrow) targeting (yellow line) EPAS1,TMEM247, ATP6V1E2 and RHOQ; it also potentially disrupts a loop (black dot and inverted triangle) boundary. This region shows an additional 119 bp insertion (purple dot) upstream of EPAS1 and SNPs with high LD r2, possibly reflecting multiple selection events.

