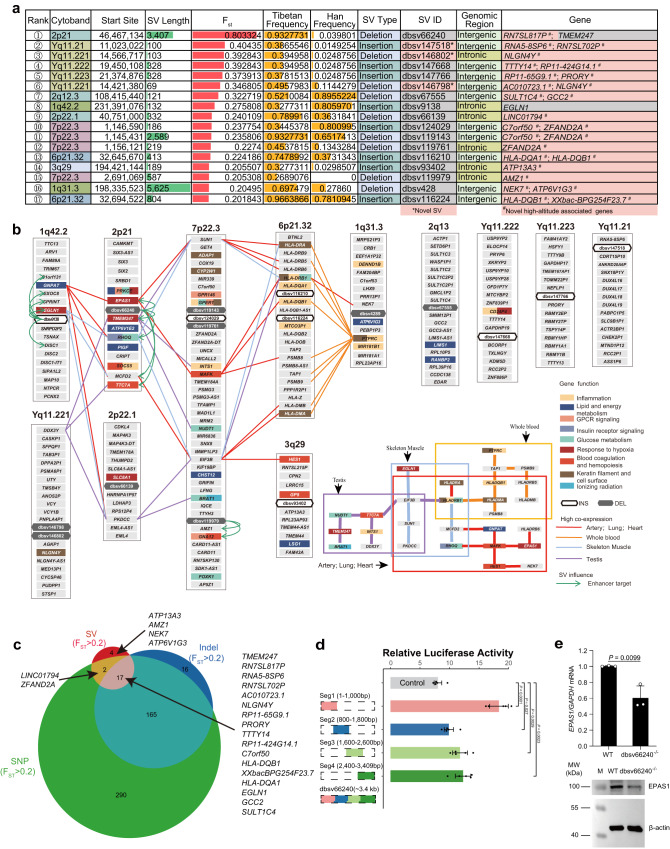
Fig. 5. Evolutionary selection of genes for adaptation to high altitude in Tibetans.
a Description of 17 SVs with an FST > 0.2 ordered by FST values. We discovered 3 novel SVs (highlighted in pink in the SV ID column) and 24 novel high-altitude-associated gene groups (highlighted in pink in the Gene column). b The biological functions (coloured rectangles) and tissue-specific high expression (coloured lines) of the protein-coding genes located near the top 17 population-specific SVs (black or white hexagons) are visualized in a network. Most of these genes are related to the response to hypoxia, inflammation, glucose, lipid and energy metabolism, insulin receptor signalling, blood coagulation and keratin filaments in these tissues, indicating their roles in high-altitude adaptation. c Venn diagram of nearby genes related to SNPs, InDels and SVs with an FST > 0.2. The high consistency between the associated genes of SNPs, InDels and SVs indicates coincidental natural selection at high altitudes. The non-overlapping genes suggest special functions of these genomic variations. d Comparison of Fluorescence intensity for the dbsv66240 deletion and control reporter proves that the deleted sequence is an enhancer. Kidney-derived 293T cells were transfected with the pGL3 control vector, Seg1, Seg2, Seg3 or Seg4 (n = 5 independent experiments per group, statistical analysis was analyzed using two-sided student’s t-test, and results were presented as mean±SD). The pRL-TK plasmid encoding the Renilla luciferase gene was cotransfected into these cells and used as an internal control for transfection efficiency. Both firefly luciferase and Renilla luciferase activities were sequentially measured 48 h after transfection. Source data are provided as a Source Data file. e EPAS1 expression in wild-type (WT, n = 3 biological independent replicates) 293T cells and dbsv66240-homozygous knock-out (dbsv66240-/-, n = 3 biological independent replicates) 293T cells verified using RT-qPCR (top panel). Statistical analysis was analyzed using two-sided student’s t-test, and results were presented as mean±SD. The abundance of unmodified EPAS1 in WT and dbsv66240-/- (n = 2 independent experiments per group) verified by immunoblotting (bottom panel). dbsv66240-/- downregulated EPAS1 at the transcriptional and translational levels. Source data are provided as a Source Data file.

