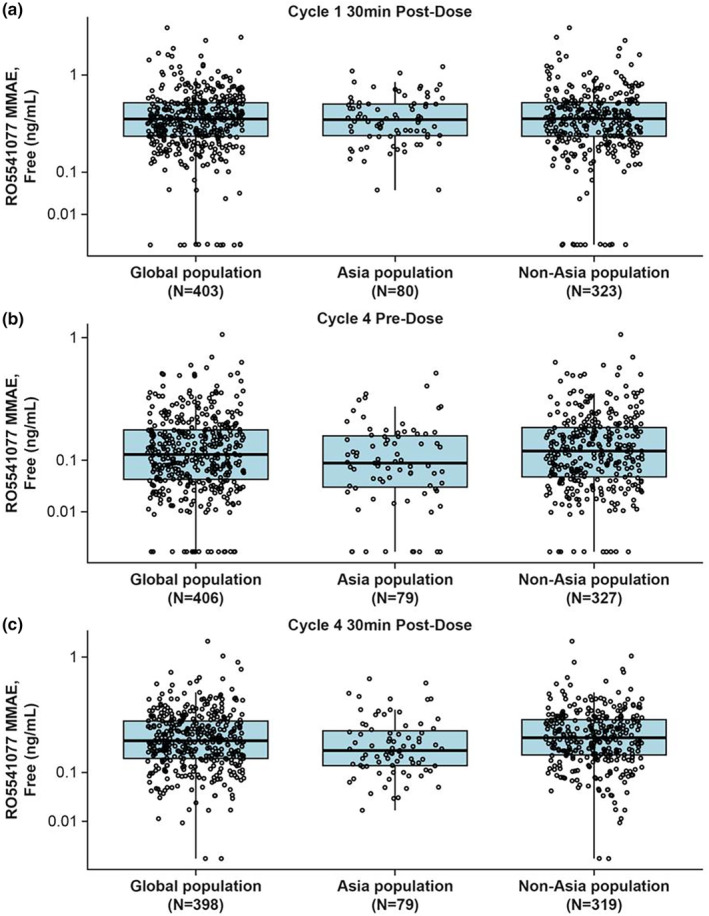
FIGURE 2.

Boxplots of unconjugated MMAE concentrations by region in patients from the POLARIX PK‐evaluable population receiving polatuzumab vedotin at 1.8 mg/kg as part of the Pola‐R‐CHP regimen, measured at (a) cycle 1 30 min postdose (C max), (b) cycle 4 predose (C trough), and (c) cycle 4 30 min postdose (C max). Box, first and third quartiles; middle bar, median; black circle, observed data points; whiskers, largest observed value within the upper fence (third quartile plus 1.5 × IQR); smallest observed value within the lowest fence (first quartile plus 1.5 × IQR). C max, maximum concentration; Ctrough, last concentration prior to dosing; IQR, interquartile range; min, minutes; MMAE, monomethyl auristatin E; PK, pharmacokinetic; Pola‐R‐CHP, polatuzumab vedotin with rituximab, cyclophosphamide, doxorubicin and prednisone.
