
FIGURE 2.
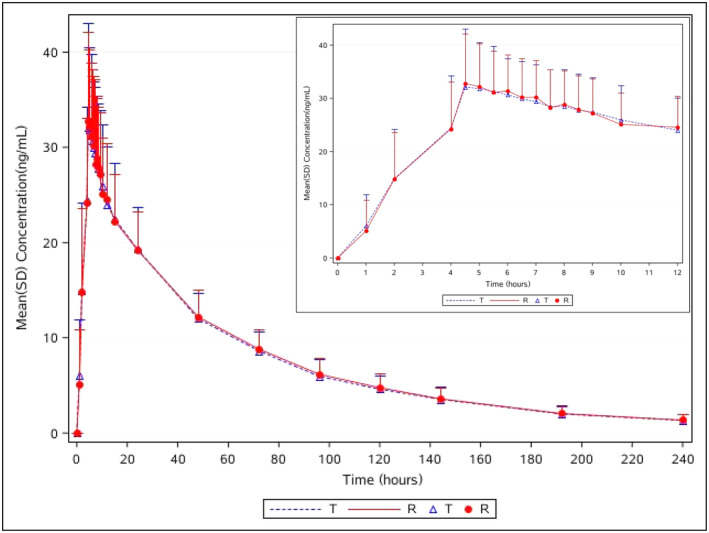
Plasma concentration versus time curves for dacomitinib and Vizimpro® under fed conditions; n = 29 for dacomitinib (T), n = 30 for Vizimpro® (R). The inset enlargement represents details of the 0–12 h period. Data are presented as mean ± standard deviation (SD). R, reference tablet; T, test tablet.