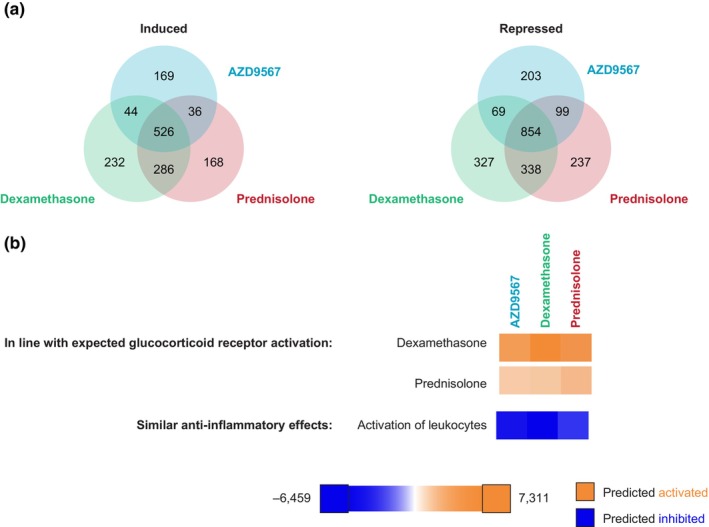
FIGURE 3.

Overall AZD9567 treatment effects on gene transcription in primary monocytes stimulated with tumor necrosis factor α at 4 h (preclinical study). (a) Venn diagrams of protein‐coding genes induced or repressed by AZD9567, prednisolone, and dexamethasone at their highest concentrations (949, 3162, and 316 nM, respectively; false discovery rate < 0.05); (b) predicted upstream regulator analysis and pathway analyses of differentially expressed genes. A full list of protein‐coding genes induced or repressed by AZD9567, prednisolone, and dexamethasone at their highest concentrations is included in Table S6. Color by z‐score: blue for predicted inhibition (negative z‐score) and orange for predicted activation (positive z‐score).
