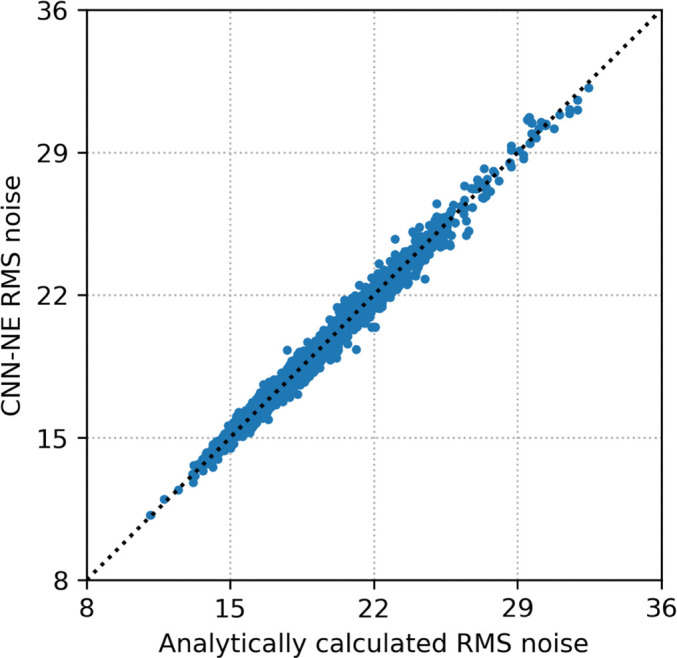
Figure 2.

The scatter plot of the CNN-NE estimated RMS noise versus the analytically calculated RMS noise for the individual patches in the CNN-NE validation set (human subject DBT images). The dotted line is the diagonal line. The RMS noise is plotted in terms of pixel values.
