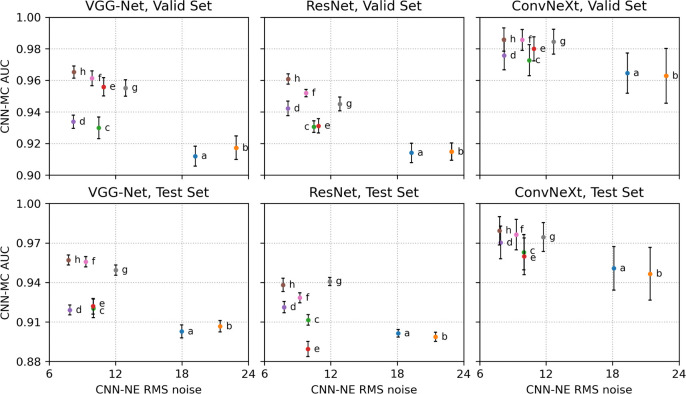
Figure 8.
The task-based image quality assessment plot on the human subject validation set (first row) and test set (second row) using the VGG-Net (left column), ResNet (middle column) and ConvNeXt (right column) for comparing the reconstruction and denoising approaches. The labels (a) to (h) are defined in section 3.4 and table 3.

