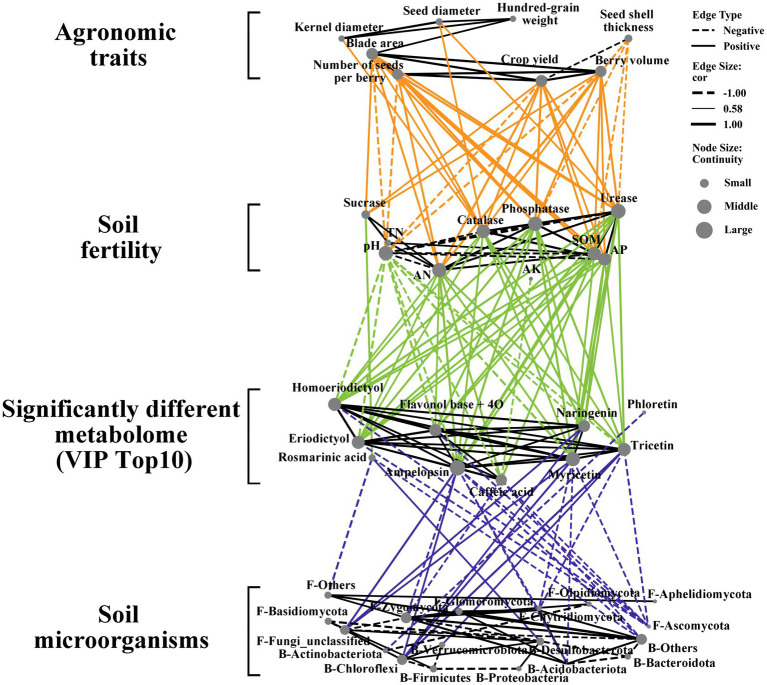
Figure 7.
Correlation network between agronomic traits, soil fertility, soil differential metabolites (Top 10 VIP value) and microorganisms (Top 8 bacterial and fungal abundance) between different treatment groups (Spearman, p < 0.05). The solid line represents a positive correlation and the dashed line represents a negative correlation.

