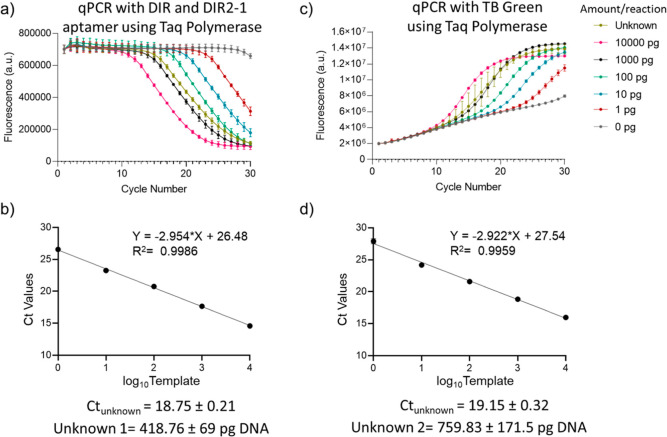
Figure 3.
Determination of the concentration of an unknown DNA sample with qPCR using conventional and light-up dye-aptamer detection chemistry. (a) Exponential decrease in DIR dye and DIR2-1 aptamer fluorescence with the progress of the PCR reaction using Taq polymerase. (b) Ct values were calculated from (a) and plotted against the log10 (DNA amount). The curve was fitted to a linear model and the fitted equation with the R2 value is shown. Each curves represents the mean and standard deviation of n = 4 replicates. (c) Exponential increase in fluorescence with the progress of the PCR reaction using Taq polymerase and DNA intercalating dye TB green, n = 4. (d) Ct values were calculated from (c) and plotted against the log10 (DNA amount). The curve was fitted to a linear model and the fitted equation with the R2 value is shown. Each curves represents the mean and standard deviation of n = 4 replicates.

