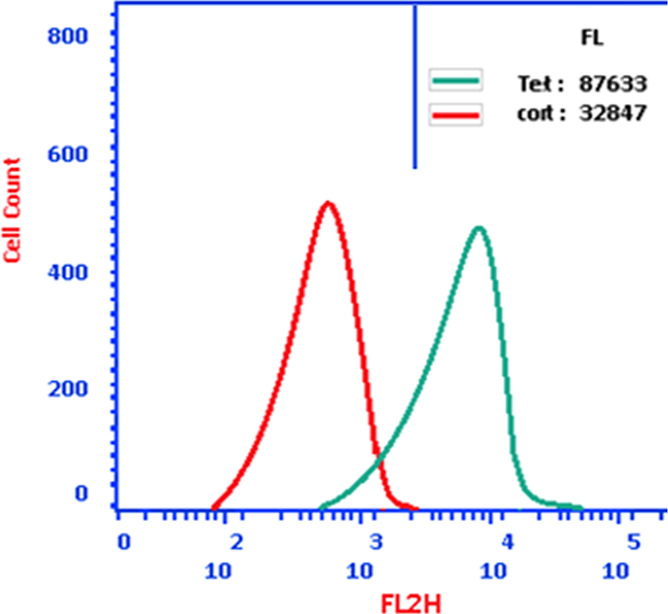
Figure 5.

Using the acridine orange lysosomal dye and the flow cytometric analysis, autophagic cell death in MCF-7 treated with compound 12 (IC50 = 1.62 M, 48 h) was assessed. The green curve represents cells treated with compound 12; the red curve represents cells under control (untreated).
