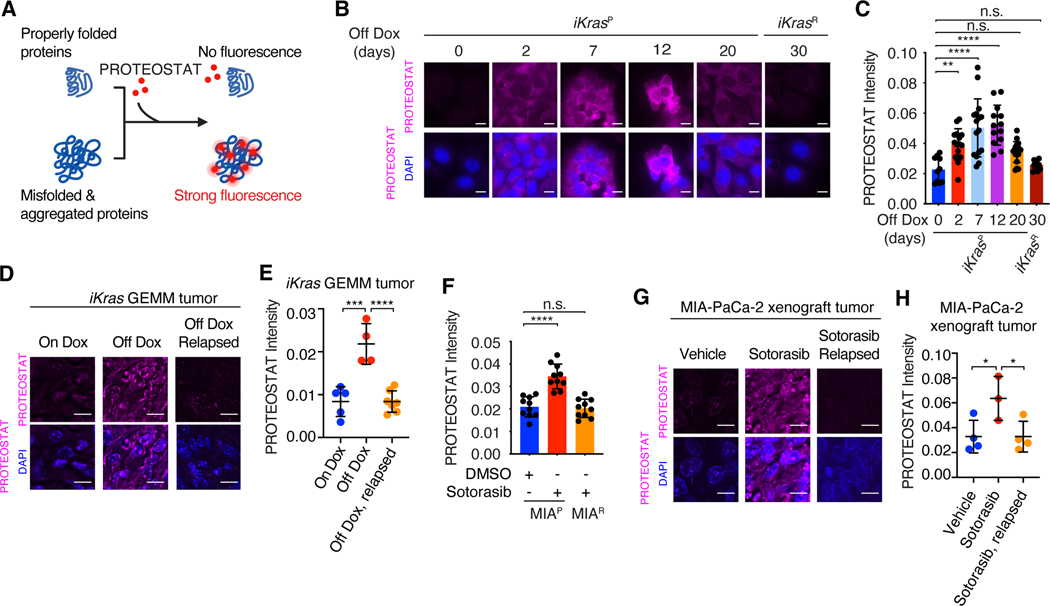
Fig. 1. Oncogenic KRAS inactivation reprograms proteostasis.
(A) Schematic illustration of labeling and detection of misfolded and aggregated proteins with PROTEOSTAT dye. Upon intercalation into the cross-beta spine typically found in misfolded and aggregated proteins, PROTEOSTAT dye emits strong fluorescence. (B and C) Representative images (B) and quantification (C) of PROTEOSTAT (magenta) and DAPI (blue) staining in iKrasP cells at different time points after KrasG12D inactivation by Dox-withdrawal (Off Dox) until the cells acquired resistance to KrasG12D inactivation (iKrasR cell). (D and E) Representative images (D) and quantification (E) of PROTEOSTAT (magenta) staining in spontaneous tumors from the Dox-inducible, KrasG12D-driven PDAC mouse model (iKras GEMM) treated with doxycycline (Dox, 2g/L, n=5), Dox withdrawal for 3 days (n=4) or relapsed after 30 weeks of Dox-withdrawal (n=7). (F) Quantification of PROTEOSTAT intensity in parental MIA-PaCa-2 (MIAP) cells treated with DMSO or 30nM sotorasib for 2 days or in sotorasib-resistant MIA-PaCa-2 (MIAR) cells treated with 30nM sotorasib. MIAR cells were generated in vitro by continued sotorasib treatment until the cells acquired resistance. (G and H) Representative images (G) and quantification (H) of PROTEOSTAT (magenta) and DAPI (blue) staining in MIA-PaCa-2 xenograft tumors treated with vehicle (n=4), sotorasib (30mg/kg for 1 day, n=3), or relapsed after 9 weeks of sotorasib treatment (30mg/kg, n=4). Data represent average fluorescence intensity of PROTEOSTAT/cell from each image (C and F) or tumor (E and H) and are presented as mean ± SD from n≥10 images. Scale bar: 20μm. Ordinary one-way ANOVA with Dunnett’s multiple comparisons test (C, E, F and H) was used to calculate P values. n.s., not significant, * P<0.05, **P < 0.01, ***P < 0.001, ****P < 0.0001.

