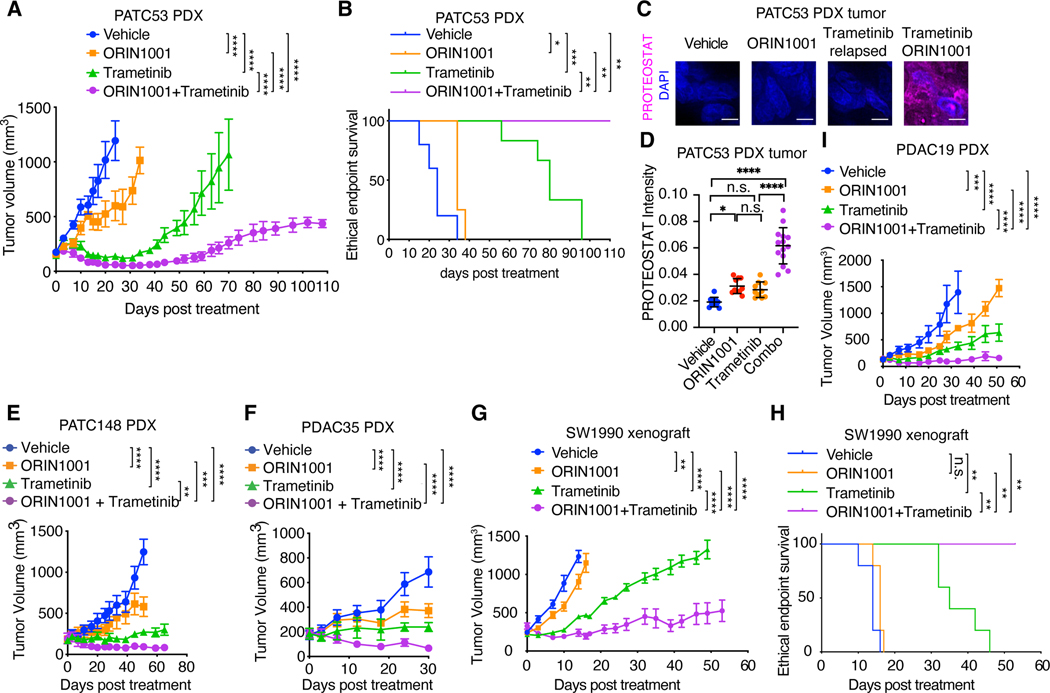
Fig. 6. IRE1α inhibition sensitizes oncogenic KRAS-driven tumors to MEK inhibition.
(A) Tumor volume quantification of established PATC53 PDX tumors in SCID/beige mice treated with vehicle (n=5), IRE1α RNase inhibitor ORIN1001 (n=4), MEK inhibitor trametinib (n=6), or ORIN1001 plus trametinib (n=4). (B) Kaplan-Meier survival curve of PATC53 PDX tumor-bearing mice under treatment as indicated in (A). (C-D) Representative images (C) and quantification (D) of PROTEOSTAT (magenta) and DAPI (blue) staining in endpoint PATC53 xenograft tumors treated as in (A). Data represent average fluorescence intensity of PROTEOSTAT/cell from each image acquired and are presented as mean ± SD from n=10 independent images. Scale bar: 20μm. (E) Tumor volume quantification of established PATC148 PDX tumors in SCID/beige mice treated with vehicle (n=6), ORIN1001 (n=6), trametinib (n=4), or ORIN1001 plus trametinib (n=4). (F) Tumor volume quantification of established PDAC35 PDX tumors in SCID/beige mice treated with vehicle (n=5), ORIN1001 (n=4), trametinib (n=4), or ORIN1001 plus trametinib (n=4). (G) Tumor volume quantification of established SW1990 PDAC xenograft tumors in SCID/beige mice treated with vehicle (n=6), ORIN1001 (n=6), trametinib (n=5), or ORIN1001 plus trametinib (n=4). (H) Kaplan-Meier survival curve of SW1990 PDAC xenograft tumor-bearing mice under treatment as indicated in (G). (I) Tumor volume quantification of established PDAC19 PDX tumors in SCID/beige mice treated with vehicle, ORIN1001, trametinib, or ORIN1001 plus trametinib (n=4). ORIN1001: 150mg/kg. Trametinib: 1mg/kg. Data are presented as mean ± SEM (A, E to G, I) or mean ± SD (D). Two-way ANOVA with Bonferroni’s multiple comparisons test (A, E to G, I), log-rank (Mantel-Cox) test (B and H), or ordinary one-way ANOVA with Dunnett’s multiple comparisons test (D) was used to calculate P values. n.s., not significant, * P<0.05, **P < 0.01, ***P < 0.001, ****P < 0.0001.

