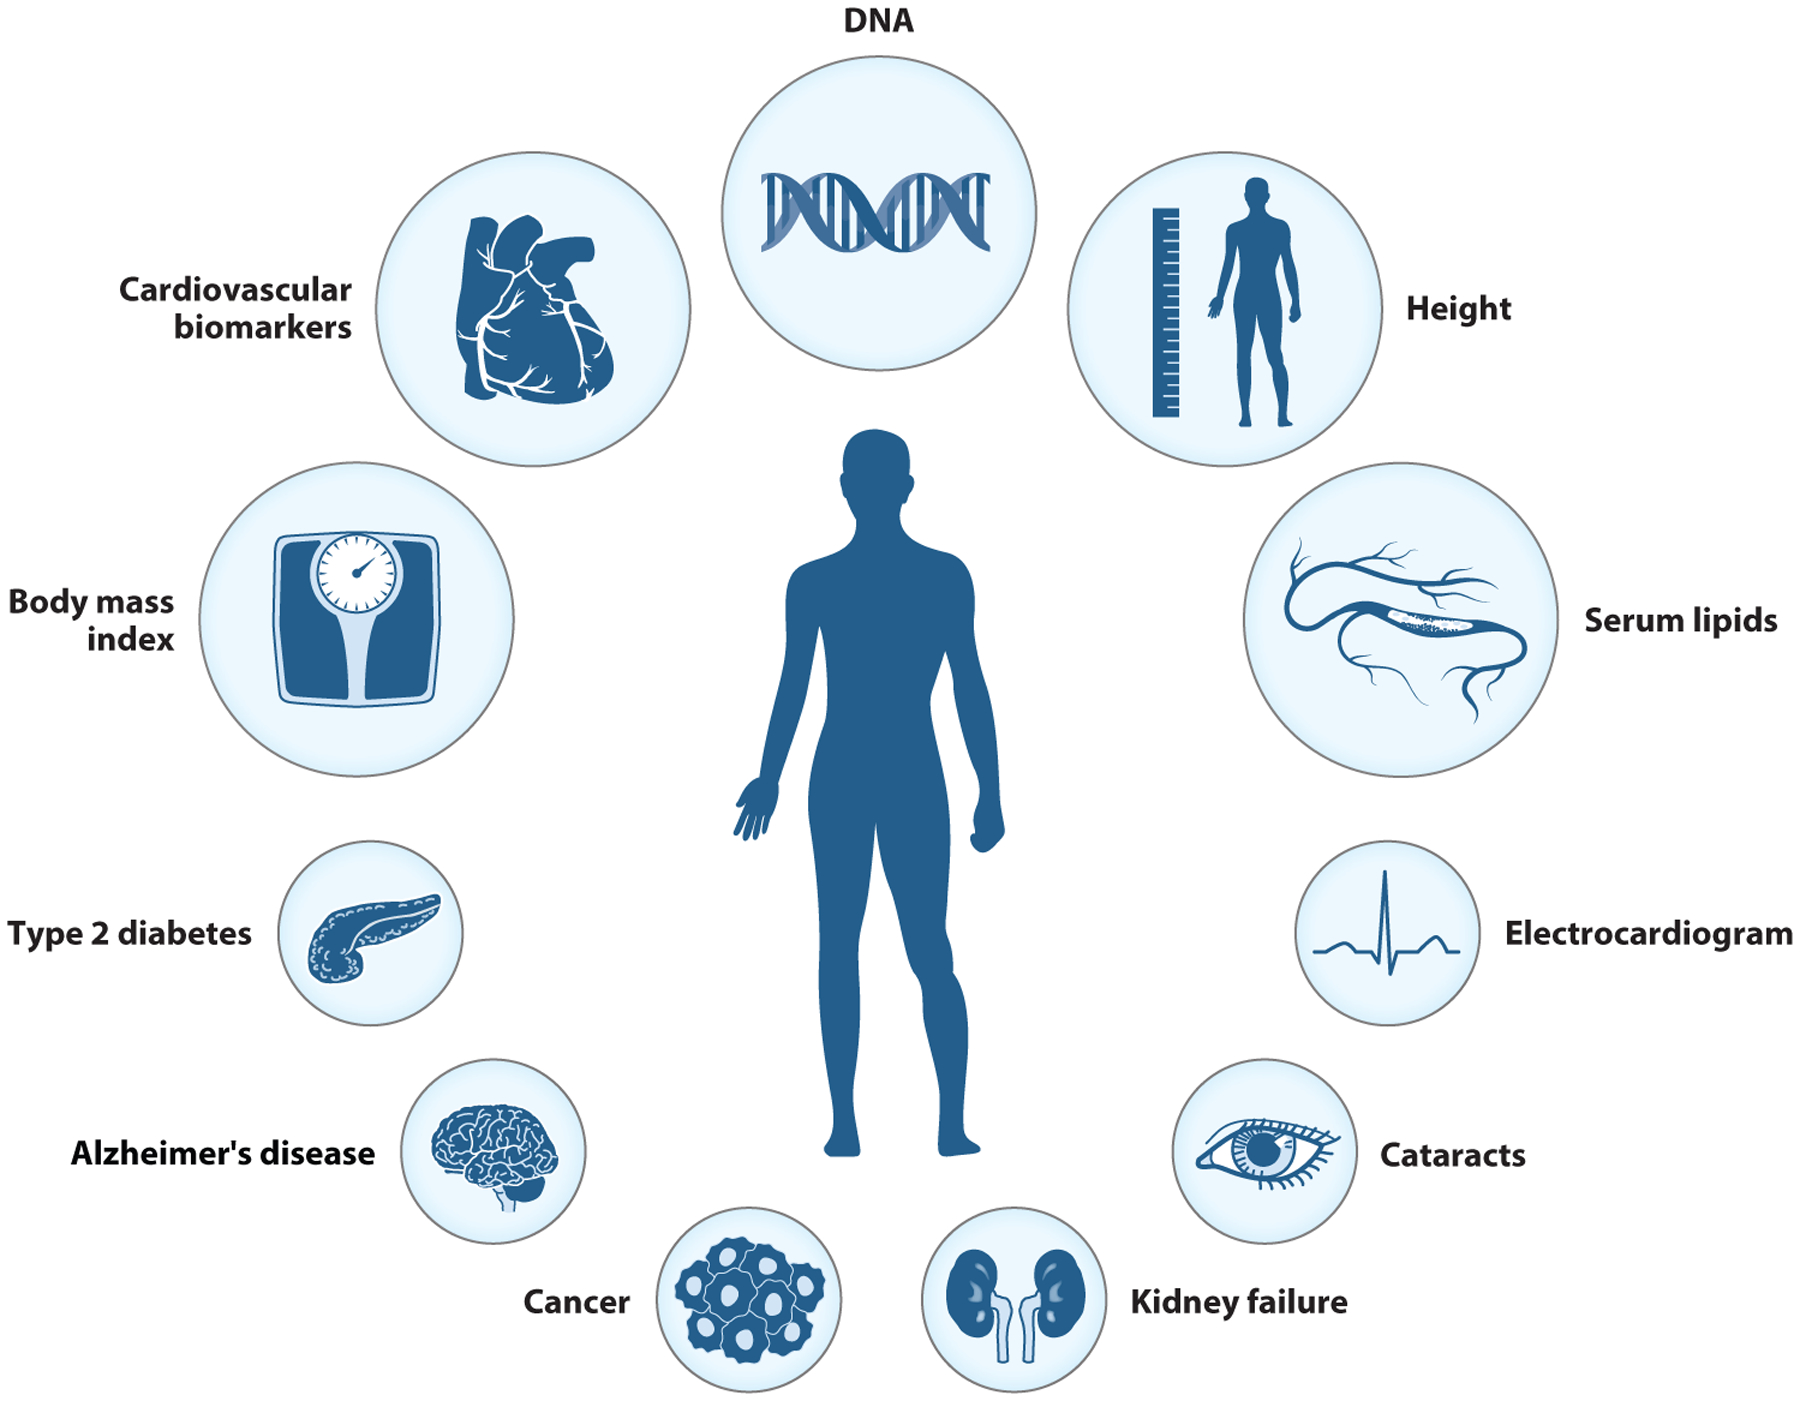
Figure 3.

The phenotypes in this figure represent commonly measured phenotypes in the described genome-wide association study consortia. The larger circles represent those phenotypes for which data have been collected for a large number of participants (sample sizes in the hundreds of thousands to millions). These include body mass index, cardiovascular/inflammatory biomarkers (C-reactive protein and erythrocyte sedimentation rate), height, and serum lipids (LDL-C, HDL-C, triglycerides, and total cholesterol). Data for these phenotypes come from a majority of the studies described in this narrative review (e.g., GIANT, CHARGE, PAGE, eMERGE, and WTCCC). Compared to the larger circles, the smaller circles represent those phenotypes that are well-described in comparatively smaller consortia (sample sizes range from thousands to tens of thousands), such as ADGC, PRACTICAL, eMERGE, and DIAGRAM. These include type 2 diabetes, Alzheimer’s disease, cancer (breast and prostate), kidney failure, cataracts, and electrocardiographic traits. Abbreviations: ADGC, Alzheimer’s Disease Genetics Consortium; CHARGE, Cohorts for Heart and Aging Research in Genomic Epidemiology; DIAGRAM, Diabetes Genetics Replication and Meta-Analysis Consortium; eMERGE, Electronic Medical Records and Genomics; GIANT, Genetic Investigation of Anthropometric Traits; HDL-C, high-density lipoprotein cholesterol; LDL-C, low-density lipoprotein cholesterol; PAGE, Population Architecture using Genomics and Epidemiology; PRACTICAL, Prostate Cancer Association Group to Investigate Cancer Associated Alterations in the Genome; WDCCC, Wellcome Trust Case Control Consortium. Figure adapted from images created with BioRender.com.
