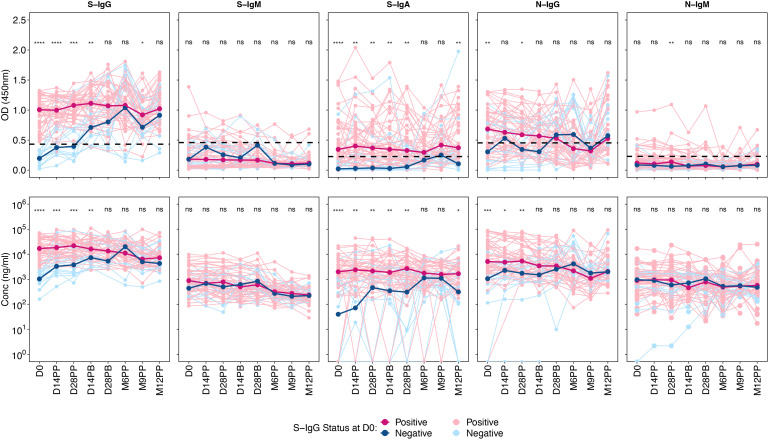
Figure 1.
Optical Densities and Concentrations of Spike- and Nucleocapsid-Directed Antibodies Following CoronaVac Vaccination, Stratified by Baseline S-IgG Levels. Figure 1 presents the optical densities (OD) and concentrations of Spike (S) and Nucleocapsid (N) proteins, segmented by subjects with baseline S-IgG positivity and negativity. An unmatched samples Wilcoxon test was employed to assess the differences in OD or concentration between the positive (red) and negative (blue) subjects at specific post-vaccination intervals. The thin, lighter lines represent individual profiles, whereas the bolder, darker lines signify the group’s median. A p-value greater than 0.05 was deemed insignificant (indicated as “ns”; not significant). Statistical significance is denoted by “*” representing a p-value less than 0.05, “**” for a p-value less than 0.01, “***” indicates a p-value less than 0.001, while “****” indicates a p-value less than 0.0001.

