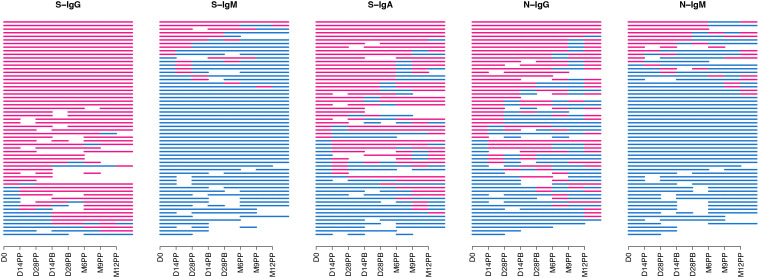
Figure 2.
Seropositivity of S-and N-directed Antibodies Following CoronaVac Vaccination. Figure 2 summarizes the temporal seroconversion patterns of participants. The horizontal line graphs represent the seropositivity status of each participant at various time points. Each line symbolizes an individual, tracing their shift between positive serostatus (OD antibody response above cut-off, in red) and negative serostatus (OD response below cut-off, in blue).

