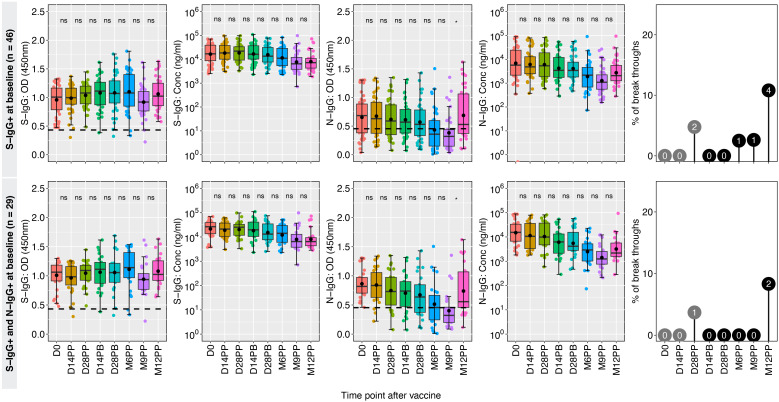
Figure 4.
Hybrid immunity among the previously exposed group. Figure 4 illustrates the dynamics of antibody responses at various time points in a cohort of 46 individuals who were seropositive for S-IgG+ and 26 individuals with combined seropositivity for S-IgG+ and N-IgG+ at baseline (D0), indicating prior exposure before vaccination. Box plots represent the summarized data of spike-directed IgG antibody OD values and concentrations, including the means (represented by dots), medians (horizontal lines), and interquartile ranges (top and bottom of the box). Additional boxplots display the OD values for S-IgA and N-IgG antibodies. Infections before the full vaccine dose are highlighted as numbers inside grey circles, while breakthroughs defined as infections within two weeks of completing the full dose are indicated as numbers inside black circles. The values enclosed in circles represent absolute numbers. The number of infections is indicated within the corresponding circles, providing insights into the infection patterns and vaccine efficacy. “*” represents a p-value less than 0.05; ns, not significant.

