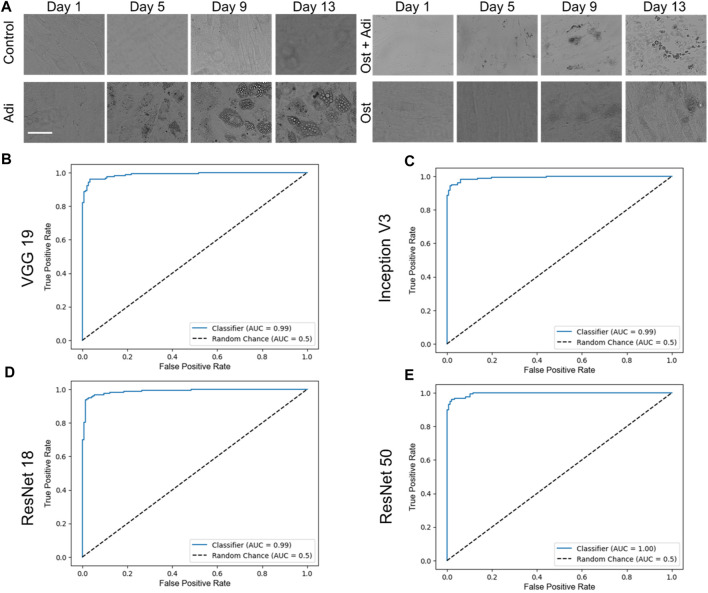
FIGURE 3.
Binary classification and respective ROC curves of four different testing models, VGG 19, Inception V3, ResNet 18, and ResNet 50. (A) Brightfield images of hMSCs under varying conditions. Control: cells were cultured in basal medium without induction; Adi: cells were induced for adipogenesis; Ost: cells were induced for osteogenesis; Ost + Adi: cells were cultured in ostegenic and adipogenic induction medium with 1:1 ratio. Scale bar: 100 µm. ROC curves of VGG 19 (B), Inception V3 (C), Resnet 18 (D), and ResNet 50 (E).

