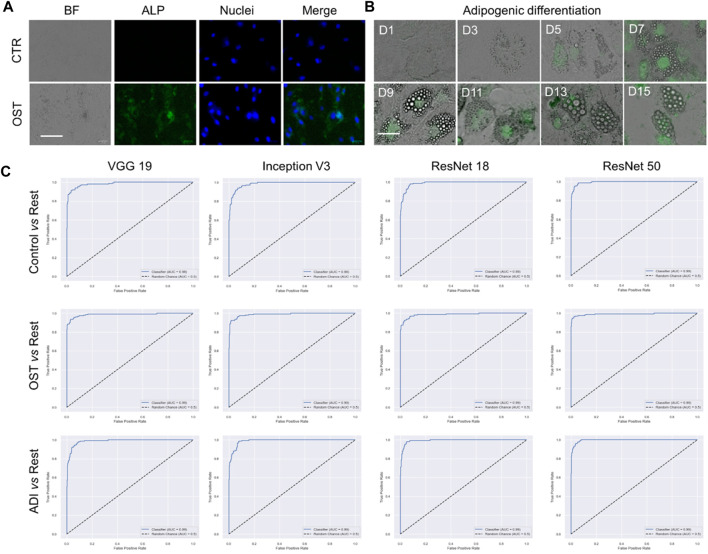
FIGURE 4.
Multi-class classification of control, adipogenic differentiation, and osteogenic differentiation. (A) Representative images of hMSCs under different conditions. Control: cells were cultured in basal medium without induction; OST: cells were induced for osteogenesis. Scale bar: 100 µm. Green: ALP staining; Blue: cell nucleus stained with HoeChst 33,342. (B). Brightfield images of hMSCs under adipogenic differentiation conditions at different time points. Green fluorescence indicates lipid marker (Bodipy). Scale bar: 50 µm. (C) ROC curves of VGG 19, Inception V3, Resnet 18, and ResNet 50.

