FIGURE 2.
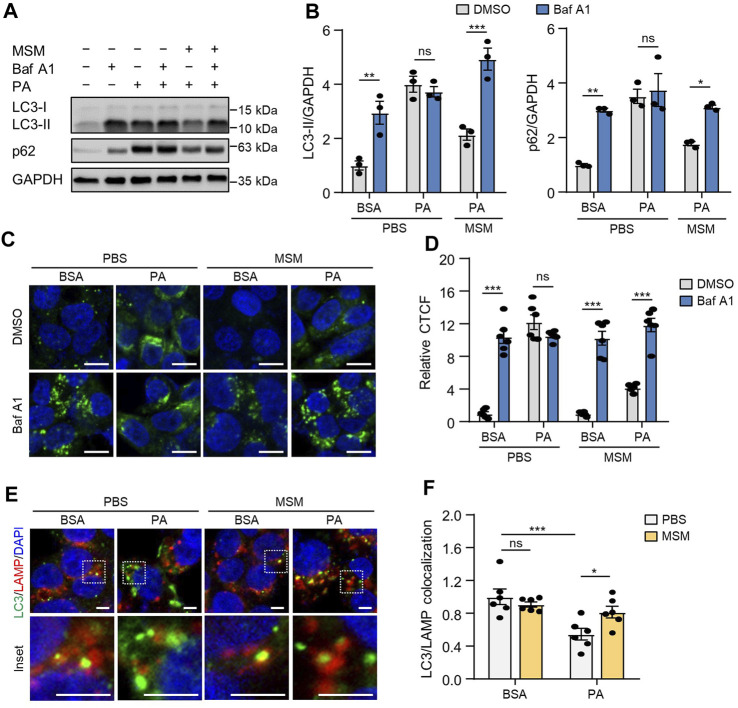
MSM reverses PA-induced impairment of autophagic flux in HepG2 cells. (A) Immunoblots of light chain 3 (LC3) and p62 in the cell lysates of HepG2 cells pretreated with 100 mM MSM for 1 h followed by 500 μM PA treatment for 12 h with or without 100 nM bafilomycin A1 for the last 3 h. (B) Band intensities were quantified and normalized to the control levels. (C) Confocal fluorescence imaging of HepG2 cells transiently transfected with the GFP-LC3 plasmid with the indicated treatments. Nuclei were stained with DAPI (blue). Scale bar, 10 μm. (D) Images were quantified for CTCF per unit area. (E) Immunofluorescence staining for LC3 (green) and lysosomal-associated membrane protein (LAMP; red) in HepG2 cells with the indicated treatments. Nuclei were stained with DAPI (blue). Boxed areas are magnified in the bottom panels. Scale bar, 5 μm. (F) Images were quantified for CTCF per unit area. Data are represented as the mean ± SEM. *p < 0.05, **p < 0.01, and ***p < 0.001 (two-way ANOVA, followed by Tukey’s (B,D) or Fisher’s least significant difference [LSD] (F) test).

