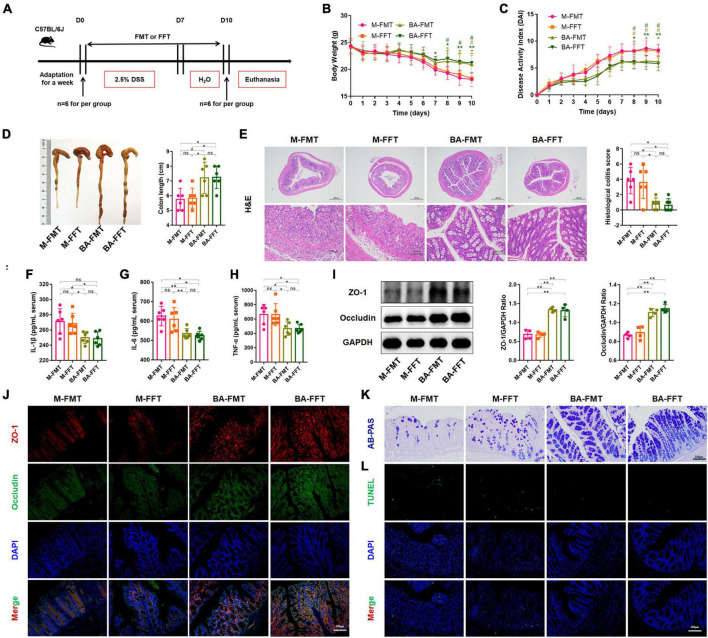
FIGURE 3.
Bacteroides acidifaciens changed the gut microbiota, and metabolites contributed to alleviating colitis. (A) Experimental design. (B) Mouse body weight. (C) DAI score. (D) Colon length. (E) H&E staining and pathological score of colon sections. (F–H) Serum IL-1β, IL-6 and TNF-α levels. (I) The expression of tight junction proteins (ZO-1, Occludin) in mouse colon tissue. (J) Immunofluorescence representative images of tight junction proteins (ZO-1, Occludin) in colonic sections. (K) Representative images of the Alcian blue-stained inner mucus layer of colonic sections. (L) Representative fluorescent pictures of TUNEL staining of colonic sections. M-FMT: transplanted with fecal supernatant of the M group; M-FFT: transplanted with fecal supernatant filtrate of the M group; BA-FMT: transplanted with fecal supernatant of the TBA group; BA-FFT: transplanted with fecal supernatant filtrate of the TBA group. Scale bar, 100 μm. Data are presented as the mean ± SD. *P < 0.05 versus the M-FMT group, # P < 0.05 versus the M-FFT group. ns, P > 0.05; */# P < 0.05; **P < 0.01.

