FIGURE 5.
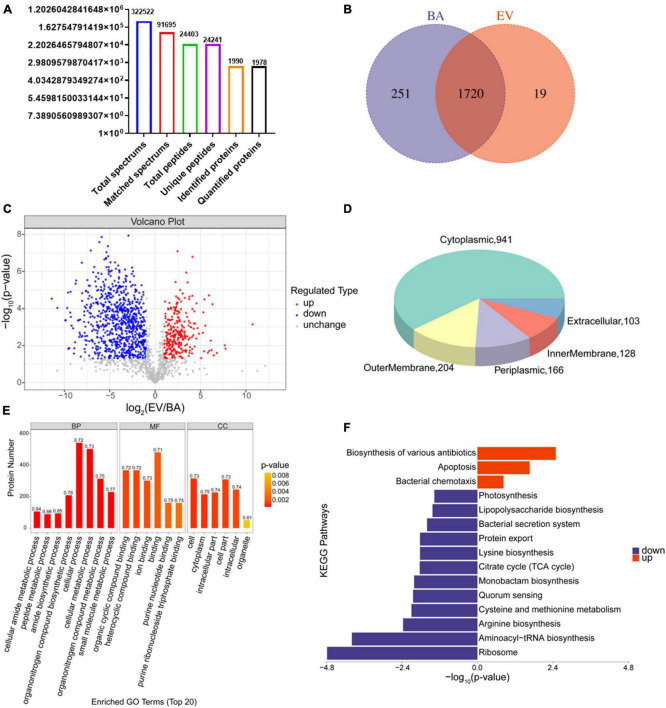
Proteomic analysis of B. acidifaciens -EVs and B. acidifaciens. (A) Summary of tandem mass spectrometry (MS/MS) database search results for B. acidifaciens-EVs and B. acidifaciens. (B) Venn diagram. (C) Volcano plot showing the number of proteins differentially expressed between B. acidifaciens-EVs and B. acidifaciens, with a cutoff of P < 0.05 and | fold change| > 2. (D) Subcellular localization pie chart of differentially expressed proteins in B. acidifaciens-EVs and B. acidifaciens. (E) GO classification (biological process, molecular function, and cellular components) of all differentially expressed proteins in B. acidifaciens-EVs and the top 20 enriched GO terms. (F) KEGG pathway enrichment analysis of the differentially expressed proteins in B. acidifaciens-EVs and B. acidifaciens. BA, B. acidifaciens; EV, B. acidifaciens-EVs. n = 3.

