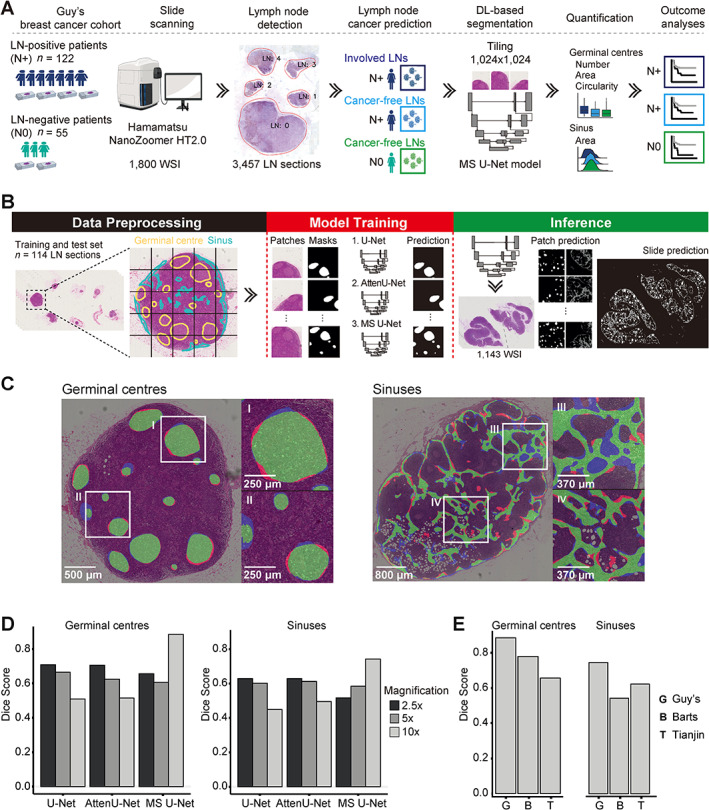
Figure 2.

smuLymphNet framework to capture GCs and sinuses on H&E‐stained LN WSIs. (A) Schematic representation of implementation for smuLymphNet framework: (1) digitising diagnostic LN glass slides from LN‐positive and LN‐negative patients diagnosed at Guy's Hospital; (2) LN‐detection algorithm to determine boundaries of each individual LN section on a WSI using an Otsu‐based thresholding method and contouring algorithm; (3) Neural Condition Random Field (NCRF) LN cancer metastasis prediction model to determine LN status for each LN section; (4) supervised deep learning pipeline using multiscale U‐Net model that assimilates semantic information from multiple resolutions to segment GCs and sinuses; (5) quantification of detected immune features, including number, mean area, and mean circularity of GCs per LN and total area of sinuses in LN normalised by LN area; (6) outcome analyses with immune features as variates. (B) Segmentation DL‐based pipeline is divided into data preprocessing, model training, and inference. In the data preprocessing step, LN sections were manually annotated for both GCs (marked in yellow) and sinuses (marked in blue) and split into tiles along with ground‐truth binary masks. Tiles and masks of 114 LN sections form the input to train and evaluate FCNs based on U‐Net architecture. Three models were evaluated: U‐Net, attention U‐Net (AttenU‐Net), and multiscale U‐Net (MS U‐Net). In the inference part, models were applied to 1,143 WSIs using the tile‐based approach, and predictions were stitched together to produce entire segmentation masks. (C) Two examples of MS U‐Net model segmentation. The MS U‐Net pixel‐wise prediction is overlaid on H&E image. True positives, i.e. GC or sinus pixels correctly predicted as GC or sinus, are shown in green; false positives, i.e. background pixels were incorrectly predicted as GC or sinus in red; and false negatives, i.e. GC or sinus pixels were incorrectly predicted as background in blue. (D) Bar plots show Dice coefficients of three CNN models at ×2.5, ×5, and ×10 magnification on Guy's cohort test set. GC prediction is shown on left, sinuses on right. (E) To test models' generalisability, bar plots display Dice coefficients for MS U‐Net on five LNs of breast cancer patients obtained from Guy's (G), Barts (B), and Tianjin (T) hospitals.
