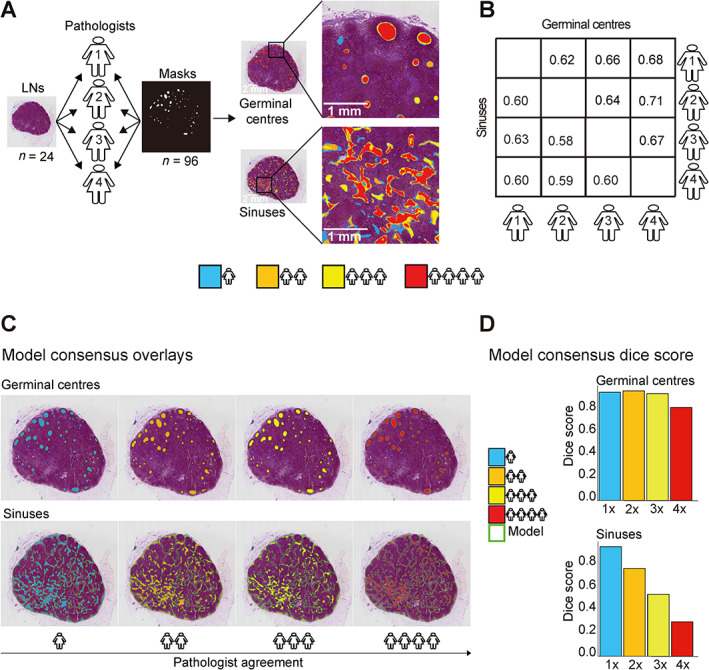
Figure 3.

Interpathologist concordance. (A) Four pathologists annotated GCs and sinus areas of the same LNs on 24 WSIs using QuPath version 0.3.0. A binary mask was generated for each pathologist from the annotation files. Heatmaps illustrate the agreement between pathologists on a LN section as an example for GC (top) and sinus (bottom) annotation. The colour indicates how many pathologists marked a given area. Blue shows where only one pathologist annotated the area as a GC or sinus, and orange, yellow, and red show areas where two, three, or four pathologists agreed respectively. (B) Confusion matrix of Dice coefficient illustrates pairwise pathologists' agreements for either GCs or sinus annotation. (C) Four heatmaps of same LN; each heatmap shows areas marked by a different number of pathologists, referred to as pathologist consensus. The model predictions are overlaid on the LN. Pathologist consensus colour scheme is as follows: four pathologists (red), three pathologists (yellow), two pathologists (orange), and one pathologist (blue). Model prediction is highlighted by green contours. (D) Bar plot shows Dice coefficient for model predictions versus different sets of annotations derived from different levels of pathologist consensus (one to four pathologists agreeing) for the single LN seen in the heatmaps.
