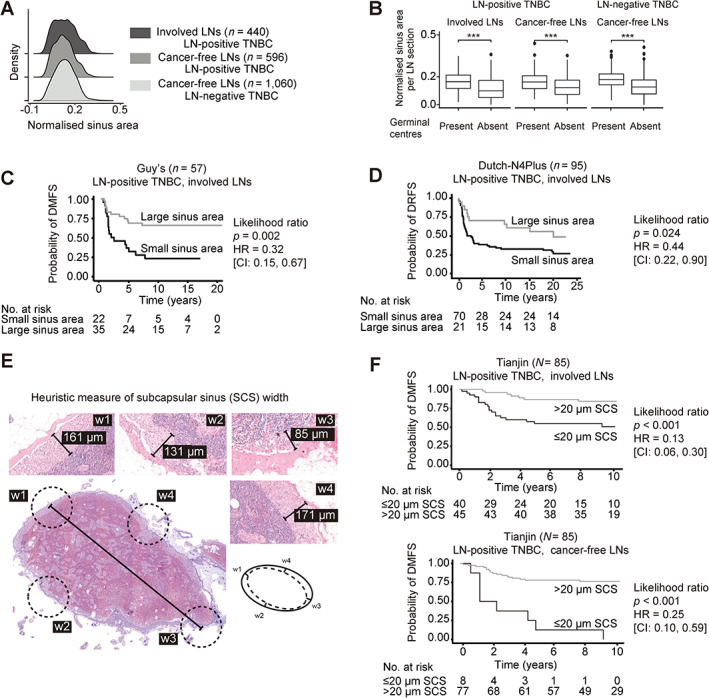
Figure 5.

smuLymphNet‐captured sinuses, their quantification, and association with disease progression. (A) The LN sections were separated into (1) involved LNs, (2) cancer‐free LNs from LN‐positive TNBC patients, and (3) cancer‐free LNs from LN‐negative TNBC patients. Normalised sinus areas per LN were determined by calculating the total smuLymphNet‐based sinus area divided by the LN section area. Density plots show distribution of normalised sinus area per LN section. Statistical significance was assessed by false discovery rate (FDR)‐adjusted Kruskal–Wallis tests. (B) Boxplots showing normalised sinus area per LN section separated by LNs in which GCs were present or absent. Statistical significance was assessed using a two‐sided Wilcoxon rank sum test (***p < 0.001). (C) Kaplan–Meier analyses of distant metastasis‐free survival (DMFS) for LN‐positive TNBC patients of Guy's cohort. (D) Kaplan–Meier curve of distant recurrence‐free survival (DRFS) for TNBC patients of Dutch‐N4plus trial. Patients for both cohorts were dichotomised based on their normalised sinus area of LNs. P values correspond to likelihood ratio tests. Hazard ratio (HR) and 95% confidence intervals (95% CI) are listed. (E) To capture the SCS area by visually assessing H&E‐stained LN section. A heuristic measure of SCS width was implemented by assessing SCS at four points in a LN, and their average resulted in the final SCS width. (F) Kaplan–Meier curves of DMFS for LN‐positive TNBC patients of Tianjin cohort. Patients were dichotomised based on their SCS width in all assessed involved or cancer‐free LNs as categorical variables. P values correspond to likelihood ratio tests. HR and 95% CIs are listed.
