
FIGURE 2.
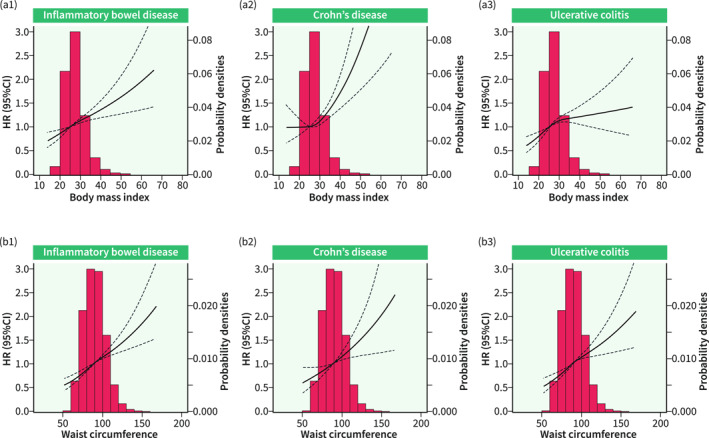
Restricted cubic spline for the association between adiposity and inflammatory bowel disease (IBD) risk. P for non‐linear relationship of plots A1, A2, A3, B1, B2, and B3 was 0.147, 0.024, 0.070, 0.358, 0.946 and 0.309, respectively.
Official websites use .gov
A
.gov website belongs to an official
government organization in the United States.
Secure .gov websites use HTTPS
A lock (
) or https:// means you've safely
connected to the .gov website. Share sensitive
information only on official, secure websites.
Restricted cubic spline for the association between adiposity and inflammatory bowel disease (IBD) risk. P for non‐linear relationship of plots A1, A2, A3, B1, B2, and B3 was 0.147, 0.024, 0.070, 0.358, 0.946 and 0.309, respectively.