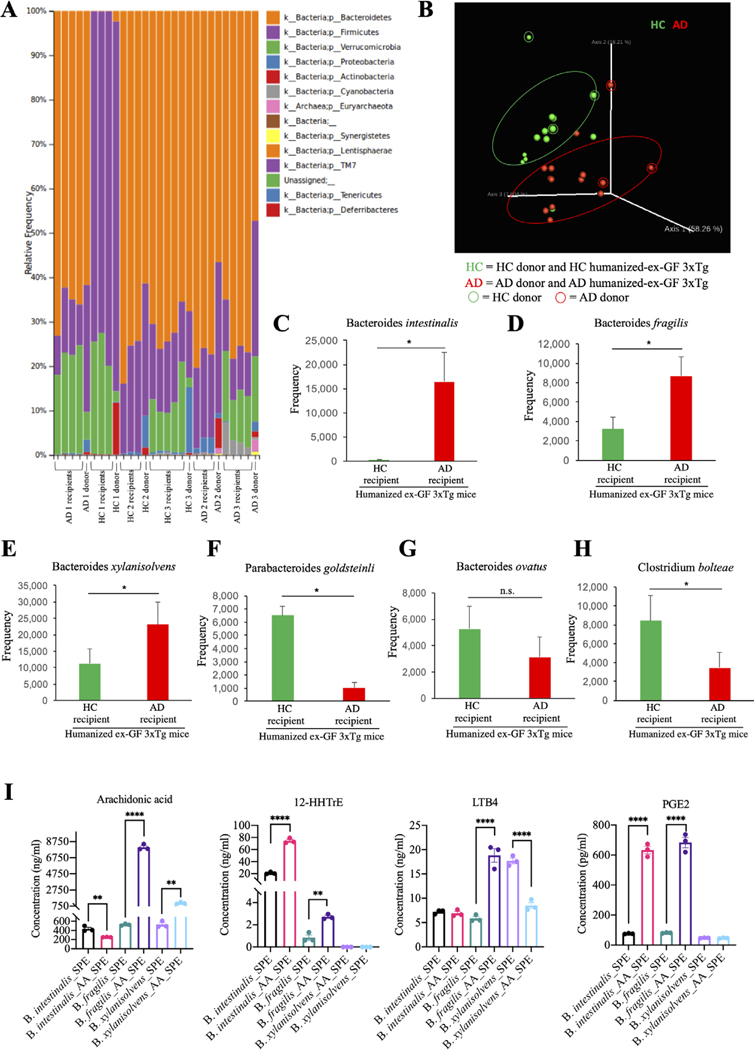
Figure 5.
Microbiome analysis in humanised ex-germ-free 3xTg mouse stool, revealing bacteroides elevation in the faeces from human AD faecal inoculated germ-free mice. (A) relative abundance of bacterial phyla determined by high throughput sequencing analysis. (B) principal coordinate plot (PcoA) of microbial community structure. (C–H) Mean frequency of bacterial species. Data represent the means±SEM; *p<0.05 compared with control, one-way ANOVA. (I) Concentrations of arachidonic acid (AA) and its metabolites in culture medium from in vitro culture of Bacteroides intestinalis, Bacteroides fragilis and Bacteroides xylanisolvens. Data represent the means±SEM; representative data of three samples; **p<0.01, ****p<0.0001 compared with control, one-way ANOVA. AD, Alzheimer’s disease; ANOVA, analysis of variance.

