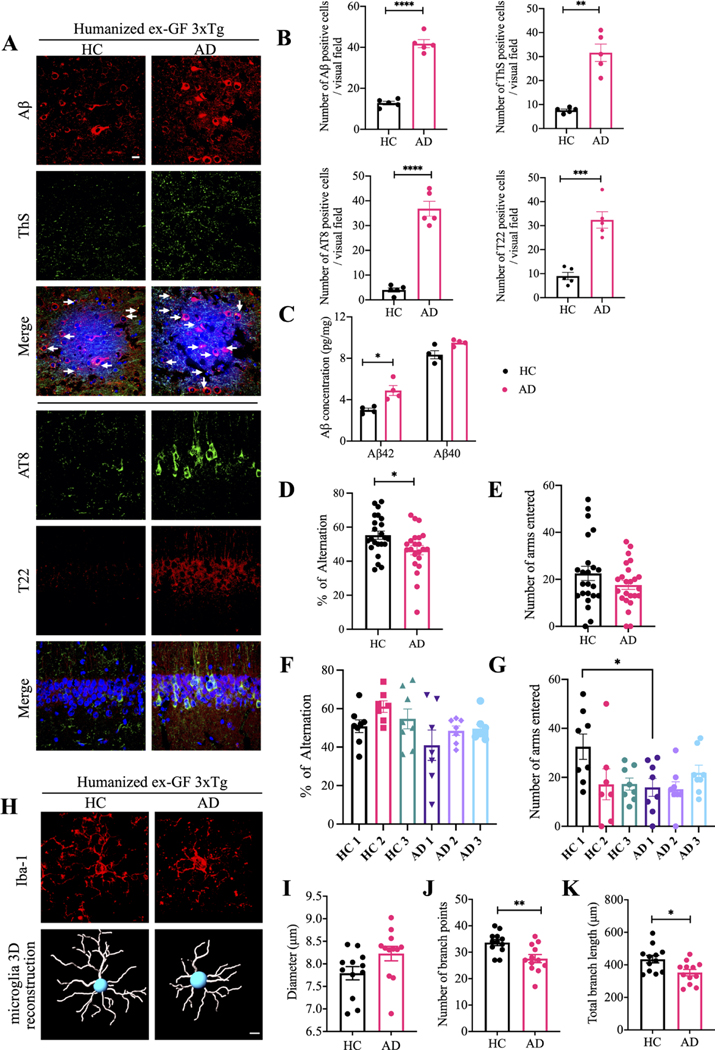
Figure 6.
AD faecal humanised ex-germ-free (GF) mice exhibit augmented AD pathologies and cognitive deficits. (A) immunofluorescent staining of Aβ (red) and ThS (green) in the frontal cortex region of brains, AT8 (green) and T22 (red) in the hippocampus CA1 region of the brains from HC humanised ex-GF 3xTg mice and AD humanised ex-GF 3xTg mice. HC, GF mice colonised with faecal microbiomes from HC; AD, GF mice colonised with faecal microbiomes from AD patients. Scale bar: 20 μm (B) quantitative analysis of Aβ positive cells, ThS positive cells, AT8 positive cells and T22 positive cells, respectively. The density of Aβ, ThS, AT8 and T22 positive cells was significantly increased in AD humanised ex-GF 3xTg mice brain. (N=5 in each group, data are shown as mean±SEM **p<0.01, ***p<0.001, ****p<0.0001 compared with control, unpaired T tests). (C) aβ40 and Aβ42 concentrations in the cortex of HC humanised ex-GF 3xTg mice and AD humanised ex-GF 3xTg mice were measured using human aβ40 and Aβ42 ELISA kit. The concentrations of Aβ42 not aβ40 were significantly increased in AD humanised ex-GF 3xTg mice cortex compared with HC humanised ex-GF 3xTg mice cortex. (N=5 in each group, data are shown as mean±SEM ***p<0.001 compared with control, multiple unpaired T tests). (D–G) Y-maze behavioural tests. (D–E) compilation of all independent cohorts in each Y-maze test: spontaneous alternation (%), number of arms entered, grouped by healthy status of faecal donor (n=23–24 in each group, data are shown as mean±SEM. *P<0.05 compared with control, unpaired t-tests); (F–G) spontaneous alternation (%), number of arms entered of mice humanised with microbiota from either AD patients or matched HCs. (N=7–8 in each group, data are shown as mean±SEM, *p<0.05 compared with control, unpaired t-tests). (H) Representative images of immunofluorescent staining of Iba-1 (red) in the cortex (upper panel) and 3D reconstruction of Iba-1-stained microglia (lower panel) residing in the cortex of HC humanised ex-GF 3xTg mice and AD humanised ex-GF 3xTg mice. (I–K) quantitative analysis of diameter, number of branch points, and total branch length of microglia residing in the cortex. data represent the mean±SEM; representative data of 12 samples; *p<0.05, **p<0.01 compared with control, unpaired t-tests. Aβ, amyloid-β; AD, Alzheimer’s disease; HC, healthy control.

