
Figure 6.
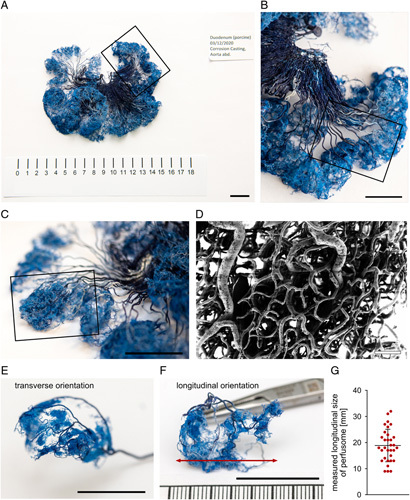
Vascular corrosion casting of small bowel. (A) Small bowel corrosion casting. (B) Subarea of (A). (C) Subarea of (B) indicating the singular perfusome of (E) and (F). (D) Scanning electron microscopy (SEM) recording of perfusome capillaries. (E) Singular perfusome in transverse orientation. (F) Singular perfusome in longitudinal orientation with red arrow indicating measured length. (G) Quantification of measured longitudinal size of perfusomes (A=2, n=32). Boxplot shows mean and standard deviation. A indicates number of animals, n indicates number of independent measurements. Scale bar in the corrosion casting equals 2 cm. Scale bar in SEM equals 100 μm.