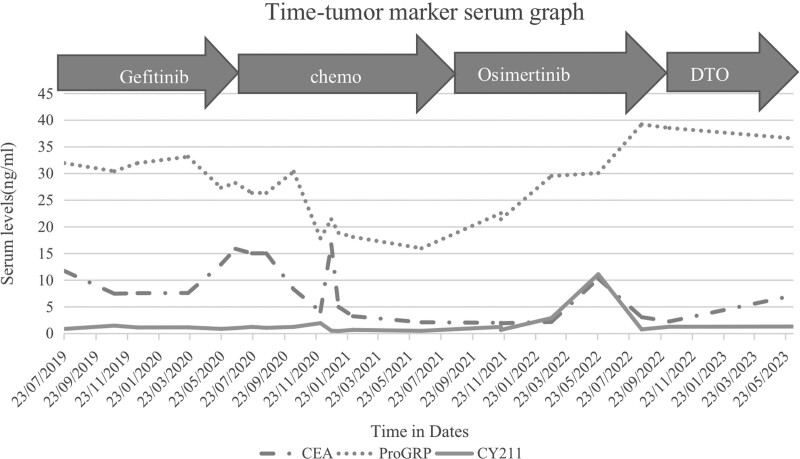
Fig. 2.
Changes in tumor serum levels during patient’s clinical course. In this figure, the fluctuations in tumor serum levels are illustrated, representing the changes observed throughout patient 1’s clinical course. (The concept is adapted from Zeng et al’.s research in Cancer Drug Resistance 2021;4 : 1019-27).

