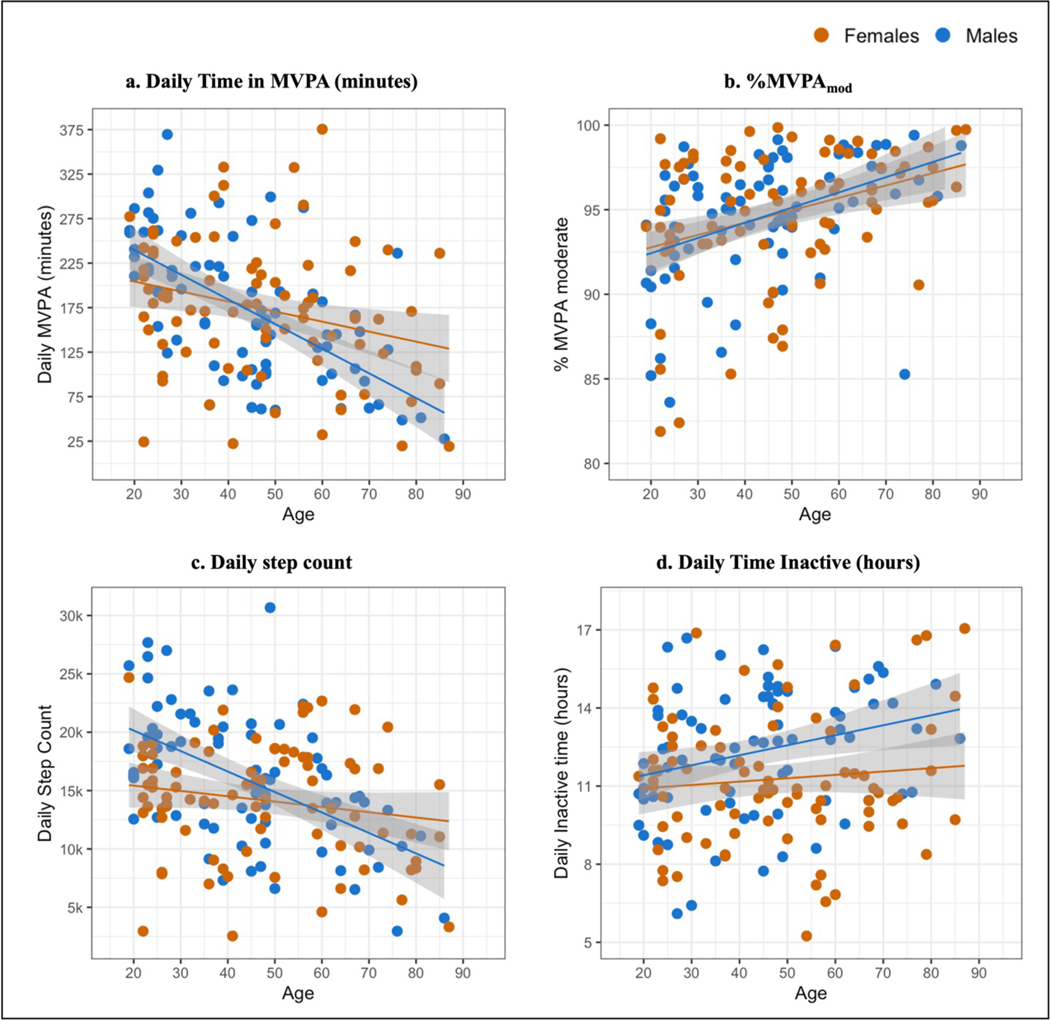
Figure 1. Physical Activity Measures by Age and Sex for Hadza participants.
Each filled orange circle represents one Hadza female participant (ages 19 to 87 years), and one filled blue circle represents one Hadza male participant (ages 19 to 86 years). Orange and blue lines represent a generalized linear model for female and male participants, respectively. Gray shaded area represents the 95% confidence interval for the regression line. Physical activity measures here are derived from wrist-worn accelerometers, and represent average daily (a) time (minutes) spent in moderate-to-vigorous physical activity (MVPA); (b) percent of MVPA time spent in moderate-intensity activities; (c) step count; (d) time (hours) spent inactive.

