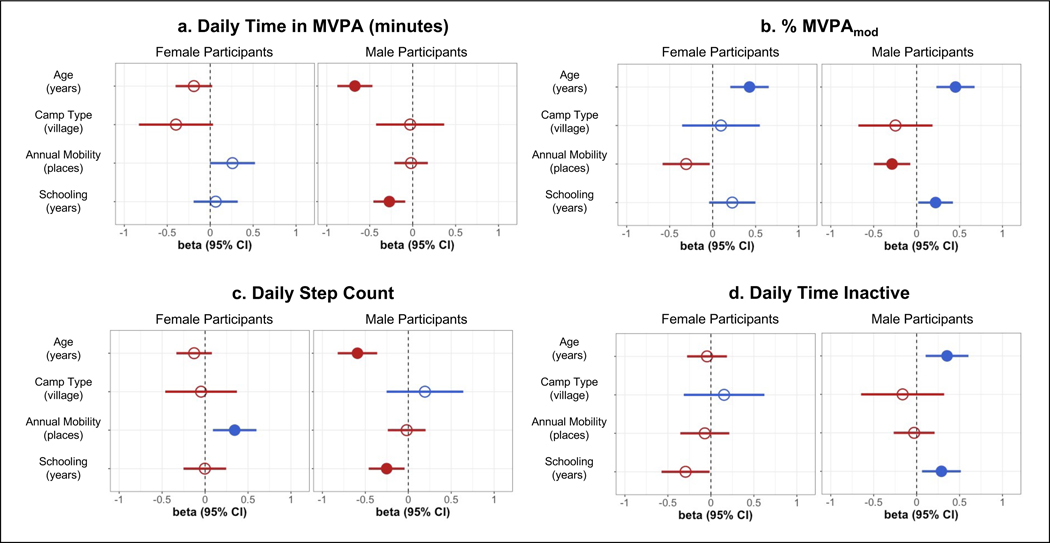
Figure 2. Effects of Age, Sex, and Foraging and Lifestyle Variables on Physical Activity Measures.
Beta coefficient plots represent results from generalized linear models, stratified by sex. Results of models with female participants are on the left of each panel, and results of models with male participants are on the right of each panel. Blue circles represent a positive beta coefficient, and red circles represent a negative beta coefficient. Unfilled circles represent a non-significant effect, and filled circles represent a significant effect, after FDR adjustment. Panels represent beta coefficient plots for average daily (a) time (minutes) spent in moderate-to-vigorous physical activity (MVPA); (b) percent of MVPA time spent in moderate-intensity activities; (c) step count; (d) time (hours) spent inactive.

