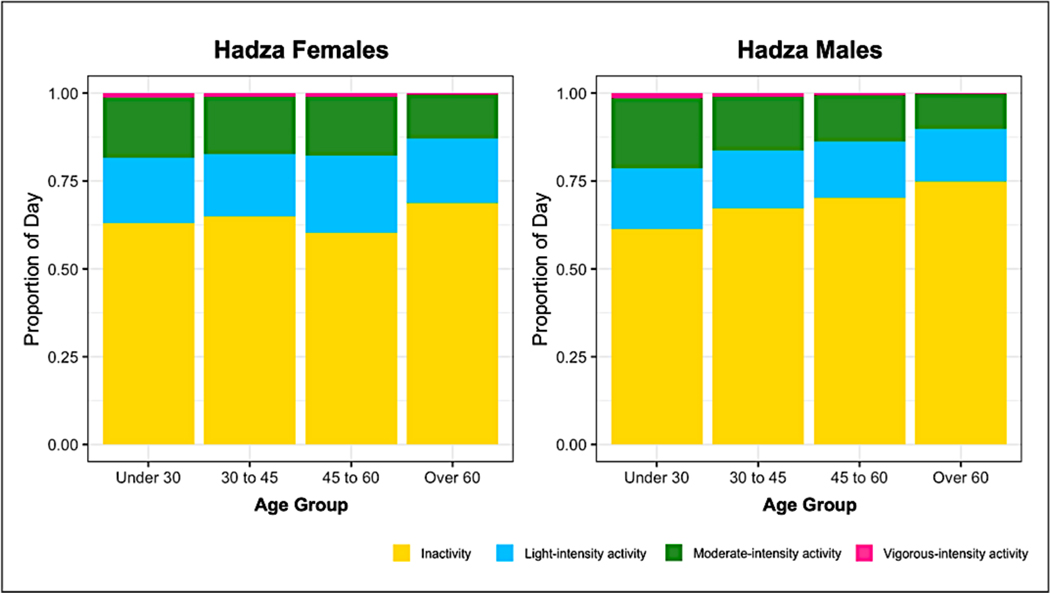
Figure 3. Proportion of Waking Hours spent in different levels of activity intensities for Hadza female (left panel) and male (right panel) participants.
Yellow shaded area represents proportion of waking hours spent inactive; blue shaded area represents proportion of waking hours spent in light-intensity activities; green shaded area represents proportion of waking hours spent in moderate-intensity activities; and pink shaded area represents proportion of waking hours spent in vigorous-intensity activities.

