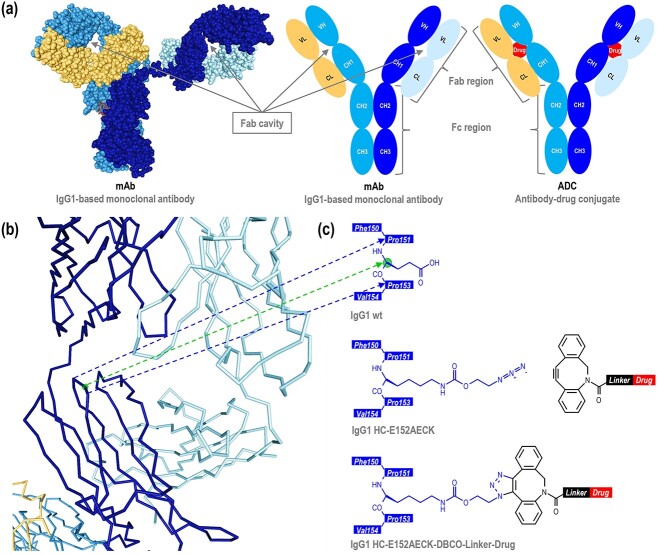
Figure 1.
Antibody design. (a) 3D (PDB: 1HZH) and schematic representations of a monoclonal antibody, and schematic representation of an antibody-drug conjugate with the drug within the Fab cavity. (b) 3D representation (PDB: 1HZH) of one of the two Fab regions. Each point represents the α-carbon of the amino acid. The amino groups, the carboxy groups, and the side chains are not represented to simplify the visualization. The sphere represents the α-carbon of the glutamic acid HC-152. (c) Schematic representations of the native antibody sequence with the sphere representing the α-carbon of the glutamic acid HC-152, the antibody sequence with AECK introduced at the position HC-152, and the antibody sequence with AECK at the position HC-152 conjugated to a DBCO-based drug-linker. Only one of the two triazole regioisomers [1, 4] is represented. Amino acids are numbered according to the IgG1-Eu described by Edelman et al. [19].

