
Figure 1. Low-affinity ETS sites are necessary for tissue-specific expression.
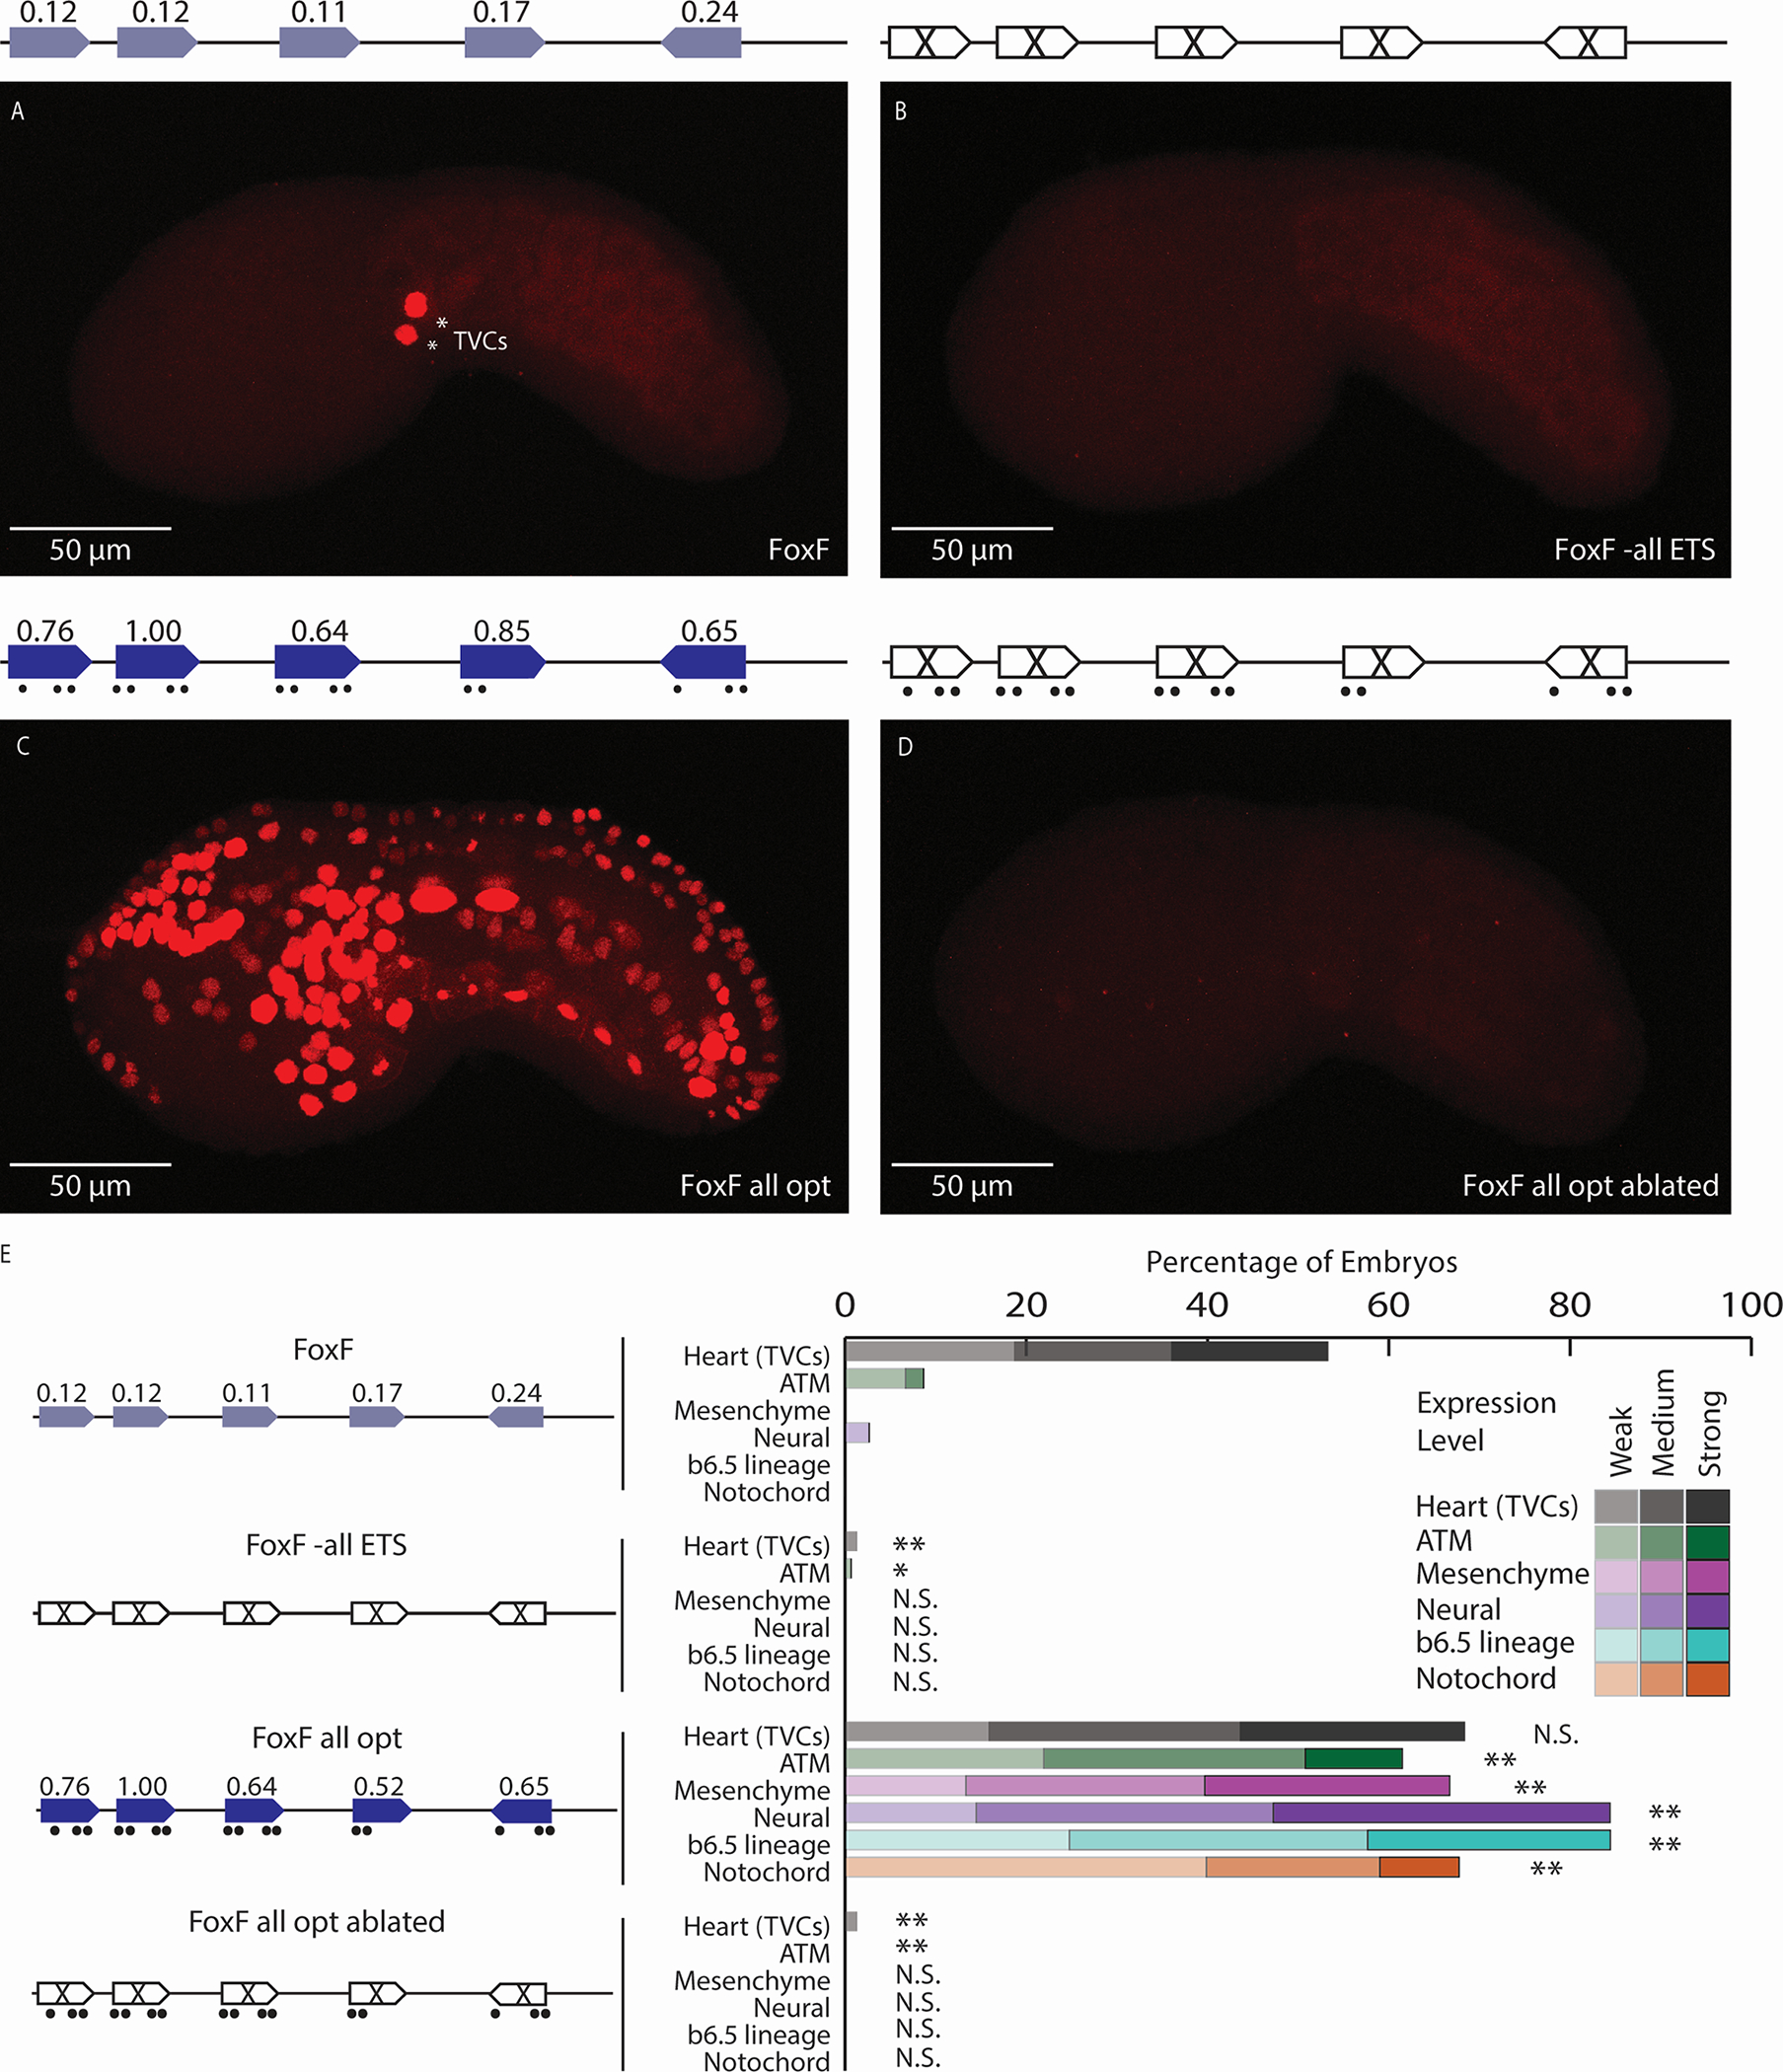
A. The FoxF enhancer drives expression in the TVCs, marked by asterisks. B. An enhancer with all six ETS sites ablated (by changing each site from GGAW to GCAW) drives no enhancer activity. C. Optimizing the affinity of all ETS sites leads to ectopic expression in ATMs, mesenchyme, nervous system, and notochord. D. Ablating the ETS sites within the context of the FoxF all opt (FoxF all opt ablated) drives no enhancer activity. E. Embryo scoring for above constructs (3 replicates, n ≥ 32 embryos per replicate). P-values are obtained using Chi-square test comparing each condition to WT with Bonferroni correction: ** P<0.0017, * P<0.017, N.S. not significant. Schematics show electroporated enhancers, values are affinities, dots show nucleotide changes. ETS6 is not shown in the schematic as ablation of this site did not impact expression (see Figure S1). Scale bars, 50 μm. Data in stacked bar chart are represented as the mean. See also Figures S1,S2 and Tables S1,S2.