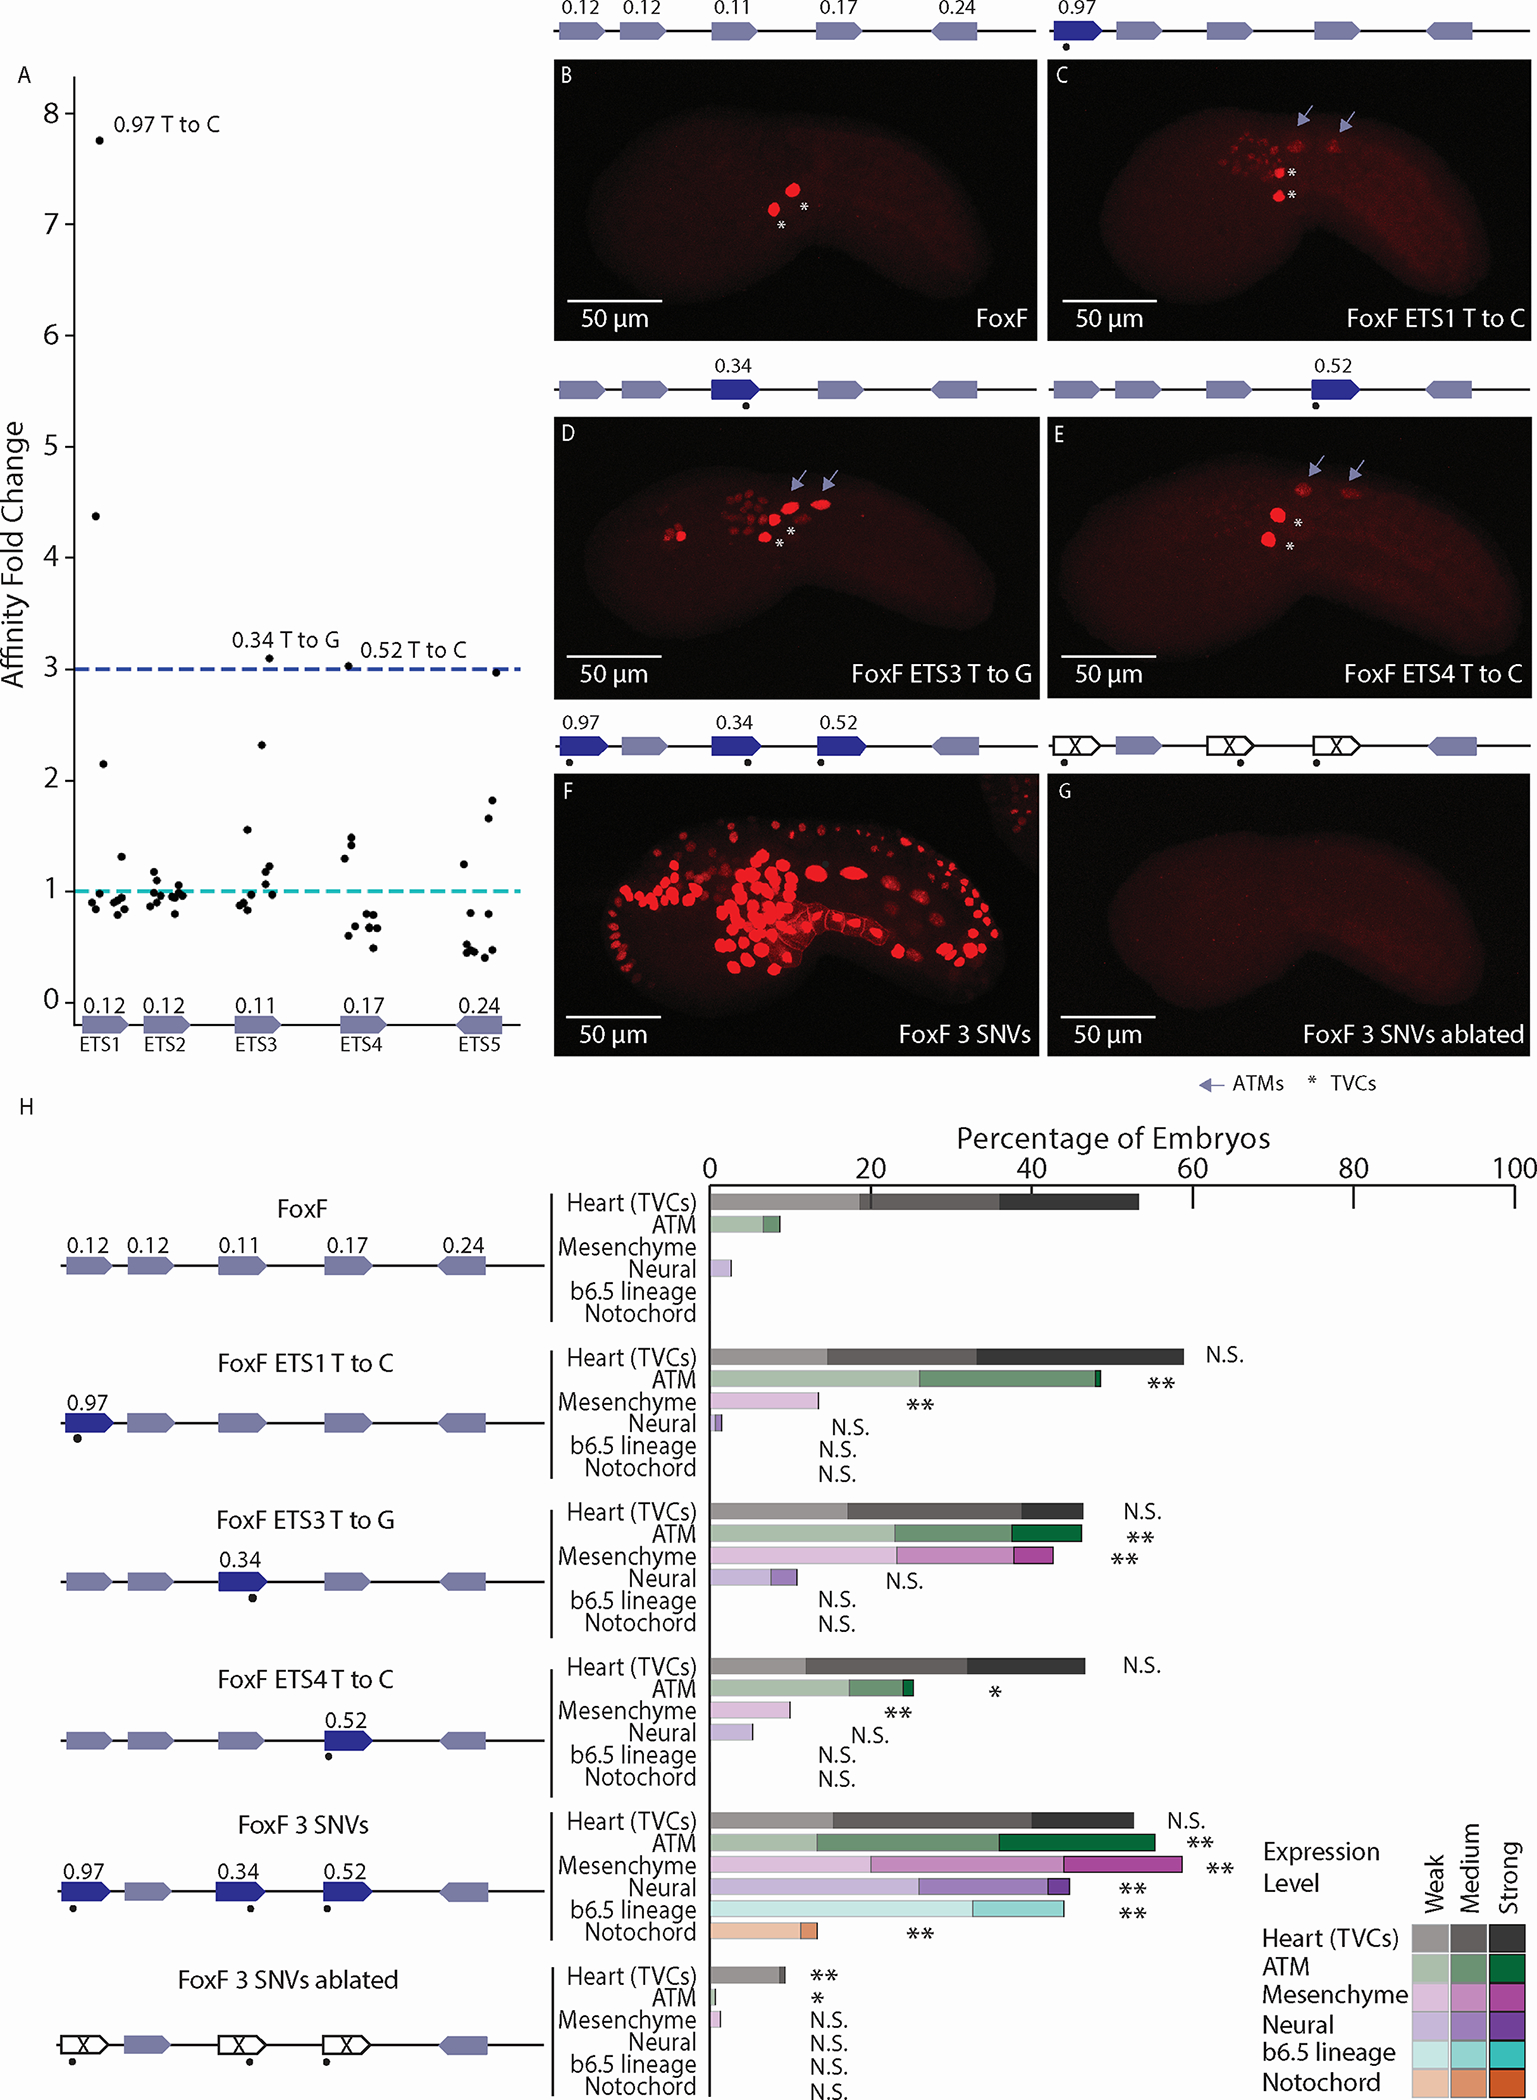
Figure 2. Affinity-optimizing SNVs lead to loss of tissue-specific expression.

A. Affinity fold change for SNVs within functional ETS sites of the FoxF enhancer. B. The WT FoxF enhancer drives expression in the TVCs. C. The FoxF-ETS1-T-to-C enhancer drives expression in the TVCs, ATMs, and mesenchyme. D. The FoxF-ETS3-T-to-G enhancer drives expression in the TVCs, ATMs, mesenchyme, and neural tissues. E. The FoxF-ETS4-T-to-C enhancer drives expression in the TVCs and ATMs. F. Optimizing the affinity of three ETS sites with SNVs leads to ectopic expression in ATMs, endoderm, mesenchyme, nervous system, and notochord. G. Ablating the ETS sites (GGAW to GCAW) within the context of the 3 SNVs no longer drives ectopic expression, only very weak TVC enhancer activity. H. Embryo scoring for above constructs (3 replicates, n ≥ 17 embryos per replicate). P-values are obtained by using Chi-square test comparing each condition to WT with Bonferroni correction: ** P < 0.001, * P <0.01, N.S. not significant. Asterisks mark TVCs and arrows mark ATMs. Schematics show electroporated enhancers, values are affinities, dots mark SNVs. Scale bars, 50 μm. Data in stacked bar chart are represented as the mean. See also Figures S2,S3 and Tables S1,S2.
