Figure 1.

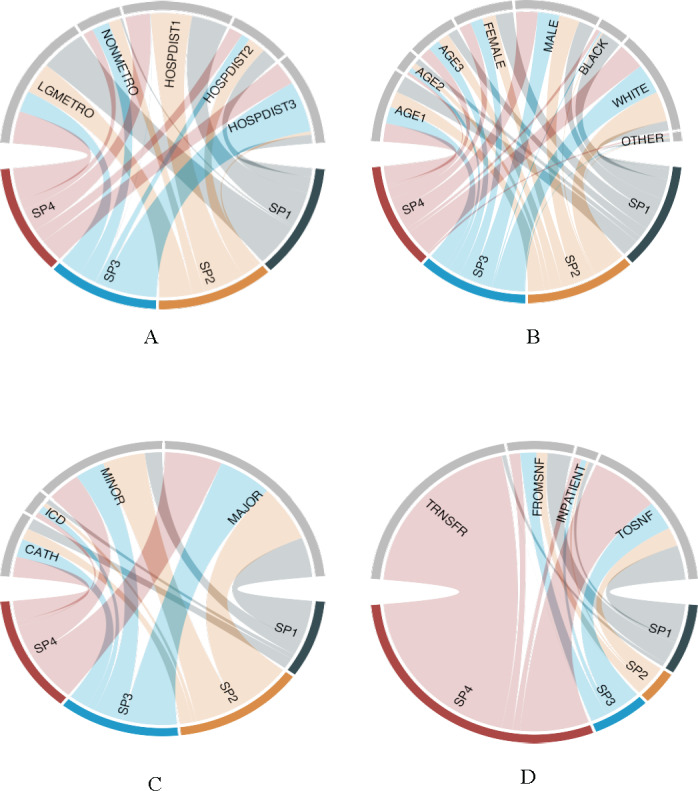
Chord diagrams demonstrating grouped characteristics for each of 4 out-of-hospital cardiac arrest (OHCA) subphenotypes. The diagrams demonstrate the grouped characteristics by each subphenotype. Each chord diagram includes key grouped features and their relationship with each subphenotype. The size of each chord (or arc) is representative of the proportional relationship between each feature and subphenotype. (A) Urban/nonurban and driving distance by subphenotype. (B) Beneficiary-level demographics by subphenotype. (C) Hospital characteristics and procedures by subphenotype. (D) Beneficiary disposition by location for each subphenotype. AGE1: beneficiary level—age category 65-74 years; AGE2: beneficiary level—age category 75-84 years; AGE3: beneficiary level—age category >85 years; BLACK: beneficiary level—Black race; CATH: beneficiary level—cardiac catheterization at index hospitalization; DRIVE: area level—percentage who drive alone at zip code level; ELX: beneficiary level—Elixhauser comorbidity index; FEMALE: beneficiary level—female sex; FROMSNF: beneficiary level—from skilled nursing facility prior to index OHCA; HOSPBEDS: hospital level—total number of beds; HOSPDIST1: beneficiary level—distance to travel to hospital from residence <8.0 kilometers; HOSPDIST2: beneficiary level—distance to travel to hospital from residence 8.0-16.1 kilometers; HOSPDIST3: beneficiary level—distance to travel to hospital from residence >16.1 kilometers; ICD: beneficiary level—implantable cardioverter defibrillator placement at index hospitalization; INPATIENT: beneficiary level—inpatient hospital stay at index OHCA; LGMETRO: area level—National Center for Health Statistics large metropolitan urban classification; LOS: beneficiary level—total hospital length of stay in days; MAJOR: hospital level—major academic teaching; MINOR: hospital level—minor academic teaching; NONMETRO: area level—National Center for Health Statistics nonmetro classification; OTHER: other beneficiary race/ethnicity (Centers for Medicare and Medicaid Services–defined categories Hispanic, Asian, Native Hawaiian or Pacific Islander, American Indian, or Alaska Native); SP1: subphenotype 1; SP2: subphenotype 2; SP3: subphenotype 3; SP4: subphenotype 4; TOSNF: beneficiary level—to skilled nursing facility after index OHCA; TRNSFR: beneficiary level—interhospital transfer at index hospitalization; TRSNFRTOT: beneficiary level—total number of interhospital transfers; WHITE: beneficiary level—White race.
