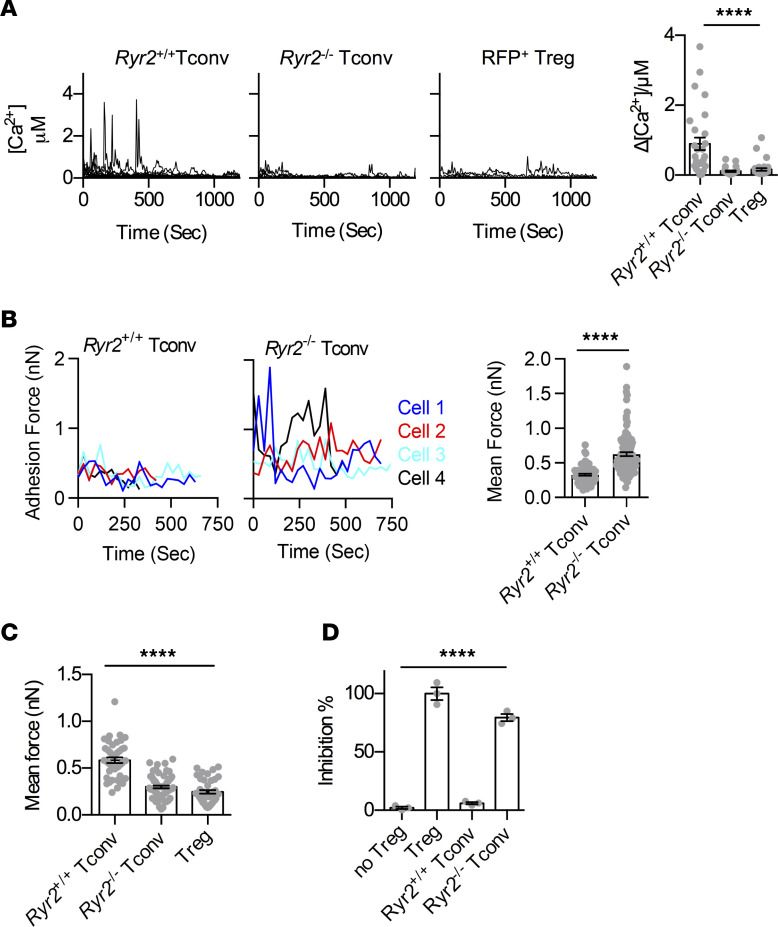
Figure 3. RyR2 deficiency genetically makes Tconvs sticky and suppressive.
(A) Resting Ryr2+/+ Tconvs, Ryr2–/– Tconvs, and Tregs were loaded with Cal Red R525/650-AM, and Ca2+ concentration fluctuations were analyzed. Each line represents one 1 (left). Corresponding amplitude was shown on the right. n = 20 per group, N = 5. One-way ANOVA with nonparametric Kruskal-Wallis test. (B) SCFS force readings for Ryr2+/+ Tconvs and Ryr2–/– Tconvs adhering to DC2.4 and their mean forces. N = 3. Two-tailed unpaired Student’s t test. (C) Mean adhesion forces between OT-II T cells and OVA-pulsed DC2.4 cells that were free or engaged by Tregs, Ryr2+/+ Tconvs, or Ryr2–/– Tconvs on the opposite side of the DC cell bodies. N = 3. One-way ANOVA with nonparametric Kruskal-Wallis test. (D) Ryr2+/+ or Ryr2–/– Tconv-mediated suppression of OT-II T cell division was analyzed. The relative inhibition efficiencies of Tregs, Ryr2+/+ Tconvs, and Ryr2–/– Tconvs are shown. The inhibition efficiency of Tregs and no Tregs was 100% and 0%, respectively. N = 3. One-way ANOVA with nonparametric Kruskal-Wallis test. ****P < 0.0001.

