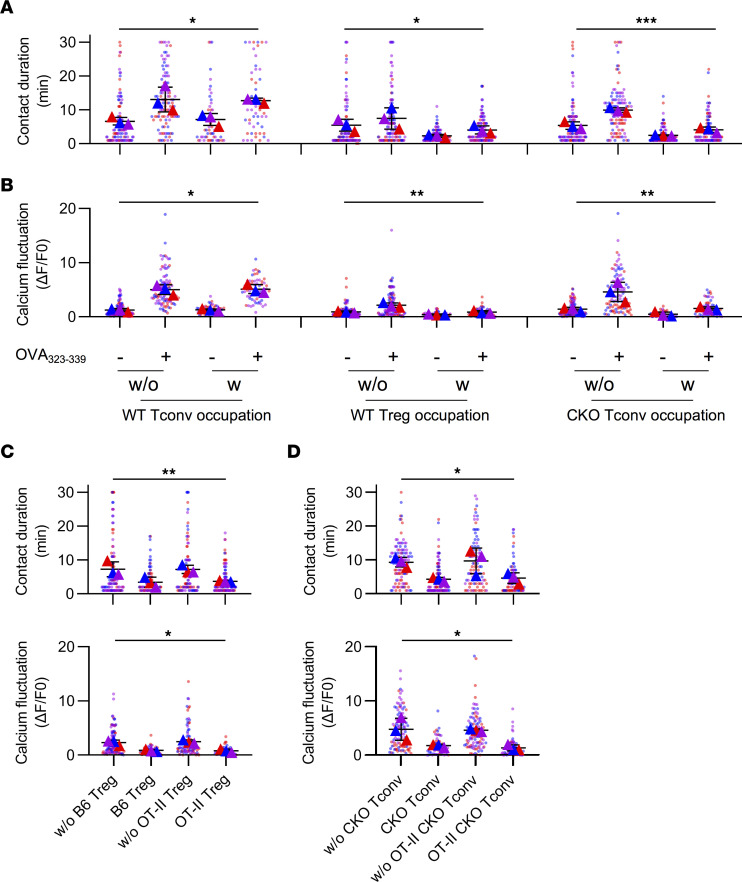
Figure 5. RyR2 deficiency–mediated suppression operates in the absence of specific antigen.
(A) Contact disruption of responder OT-II cells and DCs by suppressor cells in intravital imaging. WT Tregs and Ryr2–/– Tconvs (CKOs) were analyzed as suppressor cells, and WT Tconvs were used as negative control. Both antigen nonspecific and OVA323–339-specific contacts were analyzed. 100 contacts were analyzed for each group. w/o, OT-II–DC contacts without suppressor cell occupancy; w, OT-II–DC contacts with suppressor cells on the specific DC. N = 3. (B) Calcium signal of OT-II T cells during contacts. OT-II cells preloaded with calcium indicator FuraRed were imaged and analyzed for each condition. 100 cells were analyzed for each group. N = 3. (C and D) Contact disruption of OT-II cells and antigen-loaded DCs by suppressor cells. WT Tregs (nonspecific) and OT-II Tregs (specific) were analyzed in C. Ryr2–/– Tconvs (nonspecific) and OT-II–Ryr2–/– Tconvs (specific) were analyzed in D. 100 contacts were analyzed for each group. 100 cells were analyzed for each group. N = 3. SuperPlots were generated as follows: each dot represents 1 contact or the calcium readout of an individual cell, and each triangle represent 1 batch of an experiment. One-way ANOVA with nonparametric Kruskal-Wallis test. *P < 0.05; **P < 0.01; ***P < 0.001.

