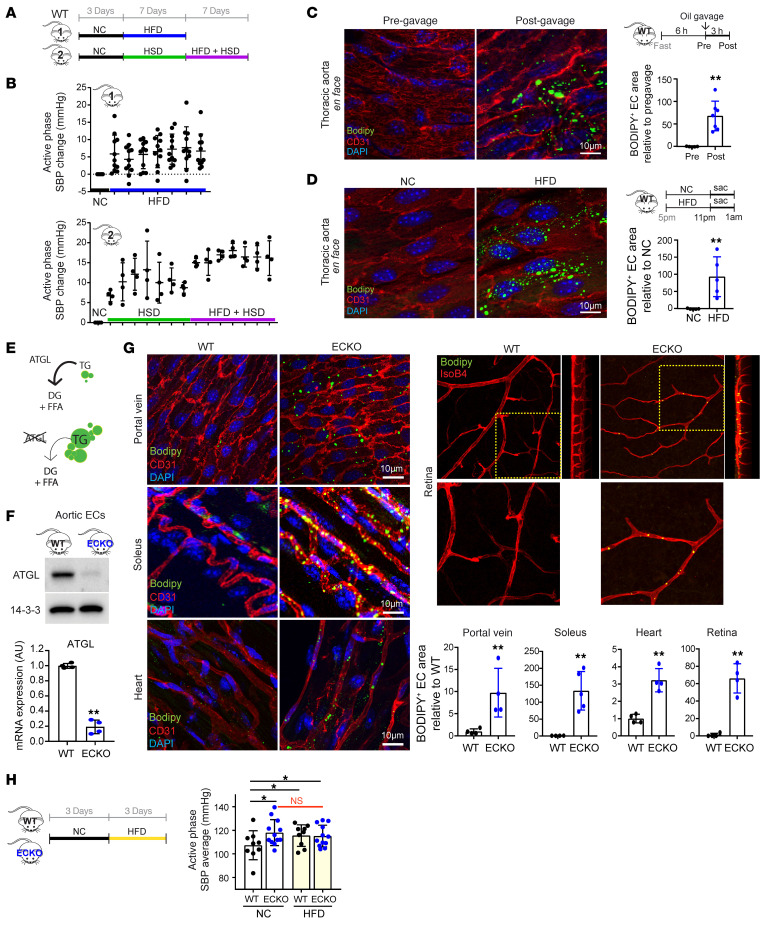
Figure 1. Endothelial deletion of Atgl phenocopies fat intake–induced accumulation of LDs and rise in BP.
(A) Experimental setup for administration of NC, HFD, HSD, or HFD+HSD in WT C57BL/6J mice, while monitoring BP by noninvasive telemetry. (B) Elevation of SBP during active phase (7 pm to 7 am) under indicated diet for 7 days. n = 11 (group 1); n = 4 (group 2). One-way ANOVA. (C and D) En face staining of thoracic aorta before and after olive oil gavage (10 mL/kg body weight) (C) or 5 hours of either NC or HFD ad libitum feeding (D) in WT C57BL/6J mice. BODIPY staining (green) indicates neutral lipids, and CD31 (red) marks the endothelium. BODIPY-positive area in the endothelium is quantified (right panel). n = 4–7 (C); n = 5 (D). **P < 0.01, t test. (E) Schematic of the role of ATGL in TG hydrolysis, yielding diacylglycerols (DG) and FFA. Deletion of ATGL leads to LD accumulation. (F) WB (upper panel) and qPCR (lower panel) of isolated aortic ECs from WT versus Atgl ECKO mice. n = 4. **P < 0.01, t test. (G) Whole-mount staining of portal vein, soleus, heart, and retina from fasted WT versus Atgl ECKO mice, imaged with BODIPY (green), anti-CD31 immunohistochemistry or IsoB4 lectin (red), and DAPI (blue). For the retina staining, side views of Z-stacked images are shown on the right, and zoomed-in images are shown below. BODIPY-positive area in the endothelium is quantified (right panel). n = 4–5. **P < 0.01, t test. (H) Left panel: experimental setup for administration of NC or HFD in WT versus Atgl ECKO mice. Right panel: average active-phase SBP in each genotype while provided with the indicated diet. n = 9 (WT); n = 12 (Atgl ECKO). *P < 0.05, 1-way ANOVA.

