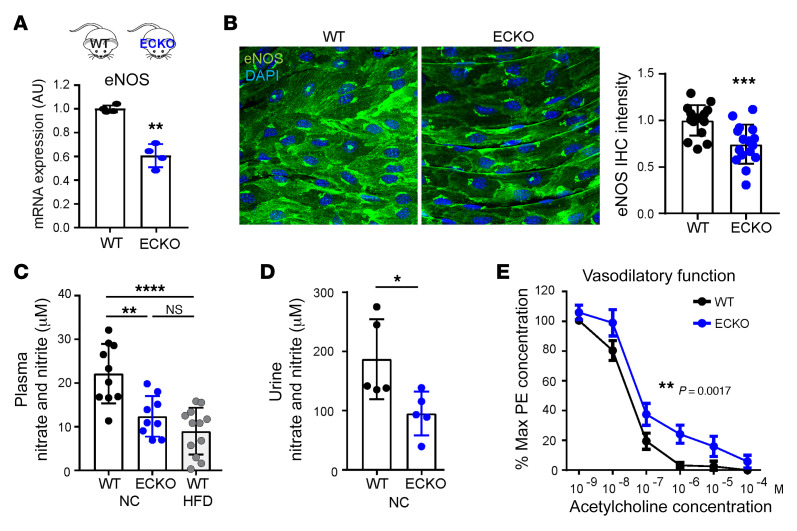
Figure 2. Endothelial deletion of ATGL suppresses eNOS and vasodilation.
(A) qPCR quantification of eNOS mRNA in ECs isolated from the lung of WT versus Atgl ECKO mice. n = 4. **P < 0.01, t test. (B) En face staining of eNOS protein in thoracic aorta from WT versus Atgl ECKO mice. Quantification of eNOS (green) fluorescence intensity (right panel). n = 16. ***P < 0.001, t test. Images were captured using a ×40 lens with a ×2 digital zoom. (C) Nitrate and nitrite levels measured in plasma from WT versus Atgl ECKO mice receiving NC and WT mice receiving HFD for 6 weeks. n = 9–12. **P < 0.01; ****P < 0.0001, 1-way ANOVA. n = 9–12 mice/group. (D) Nitrate and nitrite levels measured in urine from WT versus Atgl ECKO mice. *P < 0.05, t test. n = 5 mice/group. (E) Quantification by pressure myography of the vasodilatory response to ACh by carotid arteries explanted from WT versus Atgl ECKO mice. **P < 0.01, paired t test. n = 6 mice/group.

